September 2018 Newsletter
This message contains
graphics. If you do not see the graphics,
click here to view
Product Spotlight - QC-CALC 4.0 Released!!!

Product Spotlight - QC-CALC 4.0 Released!!!
Finally, after 4 years of development, QC-CALC 4.0, GageStation/QC-Gage 4.0, and SPC Office Buddy 4.0 were officially released this week.
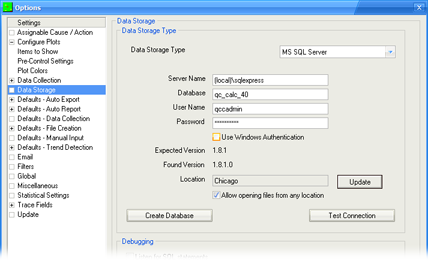
This is by far, the largest change to the software in our history. We have replaced the QCC file with two new options; the QCQ file and Microsoft SQL Server. You now have the option of choosing either (a) the file-based option (default) or (b) the server-based option allowing QC-CALC to read and write directly to your SQL Server.
Overall, QC-CALC should look and act very similar to the way it did with the QCC file, but there are several benefits to this change. The largest to be realized over the coming months is a tighter and more seamless integration of features across products and a simpler menu of products from which to choose.
- Direct access to SQL Server - For smaller implementations, QC-CALC will act the way it always has. For larger implementations, QC-CALC can write directly to SQL Server skipping the need for Enterprise Data Loader.
- Portability - The file-based QCQ file is now portable without the need for extra files with other extensions (QCN, EIF, ET3, NTS, P11, etc).
- Flexibility - The new database design allows Prolink to add functionality directly into the database within the same software version without the backward compatibility issues with QCC files.
- New Filtering - The powerful Enterprise Report Scheduler record filtering has been ported to QC-CALC and SPC Office Buddy allowing greater access to data than ever.
- Snapshots - A new feature called Snapshots has been added that allows the importing of 2D/3D CAD/solid model drawings into Enterprise Report Scheduler in order to mark characteristics for display. These pictures automatically appear in QC-CALC 4.0 and QC-Mobile 4.0 automatically as characteristic pictures.
- Location & Categories - If using SQL Server, location and categories have been added for improved grouping and categorization of part files in a multi-user environment.
Prolink to Exhibit at IMTS 2018

Prolink to Exhibit at IMTS 2018
Come visit us at Booth 135415 in the East Building!
September 10-15, 2018
McCormick Place, Chicago
September 10-15, 2018
McCormick Place, Chicago
Tip: Handling Non-Normal Data in ERS 3.4 and QC-Mobile 4.0

Tip: Handling Non-Normal Data in ERS 3.4 and QC-Mobile 4.0
Over the years we have heard from customers that want to get capability statistics from data when the data is non-normal. Typically
they are looking for statistics on single-sided form tolerances such as true position or flatness where the target is zero. When
this type of tolerance is used, you tend to get half of a bell curve which inevitably causes the data to be non-normal and the Cpk can no
longer be trusted. In these applications, you will start seeing values of N/A or -999999. As of 2018, we are now offering new options
for dealing with this type of data that include transforming it or fitting it to a non-normal distribution.
This is a relatively new but powerful feature and has been added to ERS and QC-Mobile so far with plans to implement it in QC-CALC Real-Time and SPC Office Buddy over the coming months.
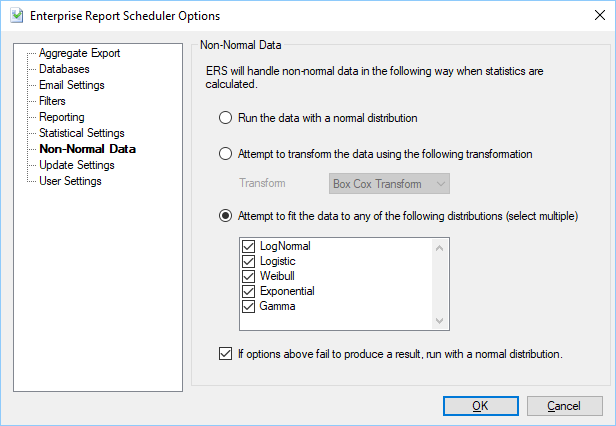
To access the settings go to Tools > Options > Non-Normal in ERS and the same in the Settings application of QC-Mobile. The settings screen looks like the one pictured here. From this screen you can determine what to do with the data when it's considered to be non-normal. Your options include the following:
This new feature is included in the latest revision of ERS 3.4 and QC-Mobile 4.0. Simply download and update to the latest to take advantage!
This is a relatively new but powerful feature and has been added to ERS and QC-Mobile so far with plans to implement it in QC-CALC Real-Time and SPC Office Buddy over the coming months.
To access the settings go to Tools > Options > Non-Normal in ERS and the same in the Settings application of QC-Mobile. The settings screen looks like the one pictured here. From this screen you can determine what to do with the data when it's considered to be non-normal. Your options include the following:
-
Attempt to transform it into normal data by applying a transform. If successful, you will be able to run normal capability statistics such as Cpk against the transformed data. Two transforms are currently offered:
- Box Cox Transform
- Johnson Transform
-
Attempt to fit it to an existing non-normal distribution using an Anderson-Darling Goodness-Of-Fit test. If successful, you will be able to get an overall process capability (Ppk), but Cpk is unfortunately not possible. Five non-normal distributions are currently offered:
- LogNormal
- Logistic
- Weibull
- Exponential
- Gamma
This new feature is included in the latest revision of ERS 3.4 and QC-Mobile 4.0. Simply download and update to the latest to take advantage!