Interactive Analysis
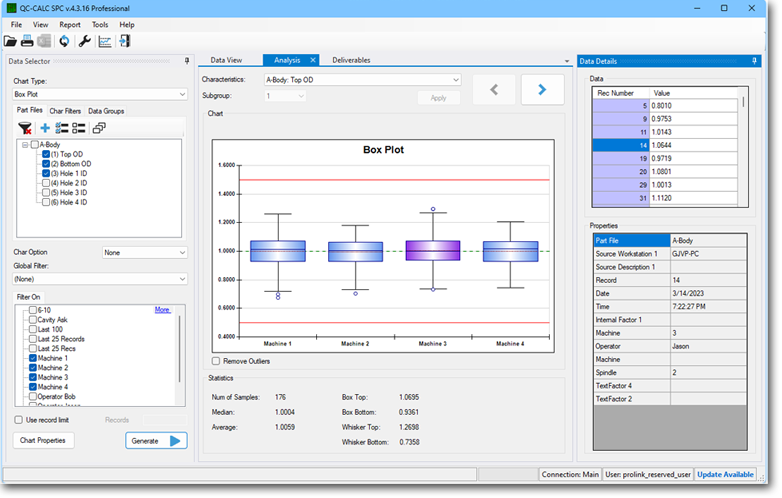
Our interactive Analysis tab allows interaction with the various charts and chart elements on the screen. Start by choosing a chart type from an expanding list of over 20 different charts. Choose the characteristics to compare from the part files in the list. Finally choose one or more record filters and click Refresh.
The data will automatically be grouped based on the chart type and displayed in the main area of the screen. Chart elements can be selected, double clicked to zoom, etc.
 Make it into a Report
With data loaded, a scheduled report is only 2 steps away using the memorize functionality from the Report menu.
Global Filter
Global filters allow an overall filter to be applied over the cycling filters. For example, an analysis is being performed using 4 filters and comparing machines 1-4. Applying a global filter of last month of data will show the comparison for only last month's data. Filters can be combined to show virtually limitless comparisons.
Statistics
Below the charts are descriptive statistics that change depending on the displayed chart or selected item. In the chart above, the user clicked the 3rd box in the Box and Whisker plot so the statistics shown apply to that one box.
Currently Supported Charts
Below is a list of currently supported interactive charts. This list is currently expanding and does not include the custom charting and gauges that can be added into the report templates themselves.