Process Capability Singles Report
The
Process Capability Singles report shows the capability of individual features
allowing you to see your best and worst performers at the part level.
Analyze parts by feature using several cycling filters to show a grouped
breakdown for comparison.
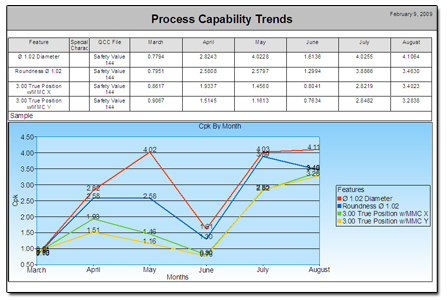
The top example shows the trending of
Cpk’s over several months both in a table and in a line chart for a
particular set of features.
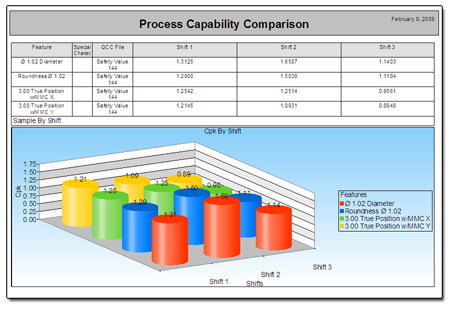
The Process Capability Comparison
example on the bottom compares the Cpk’s of each feature by shift for all
parts measured in the prior month.
In either case, the cycling filters are completely flexible allowing you to filter by date, time, part number, or any other factor you're using to track your parts.
|
|