Hotspots and Drill-Through Links
Hotspots are represented by any of a few styles of light. When created, the data and any of several trend rules to check are declared. When the data passes, the light is green. When there are trends in the data, the lights begin flashing yellow or red depending on the trend that occurred. The hotspots can also be links to other full views allowing drill through links from one full view to another (i.e. a map of the USA with lights on plant locations drilling through to the individual plant layouts). The color of the hotspot that is linked to another full view is the worst case of all hotspots on that full view. If that full view has links to other full views, the checking cascades to capture as many levels as necessary.
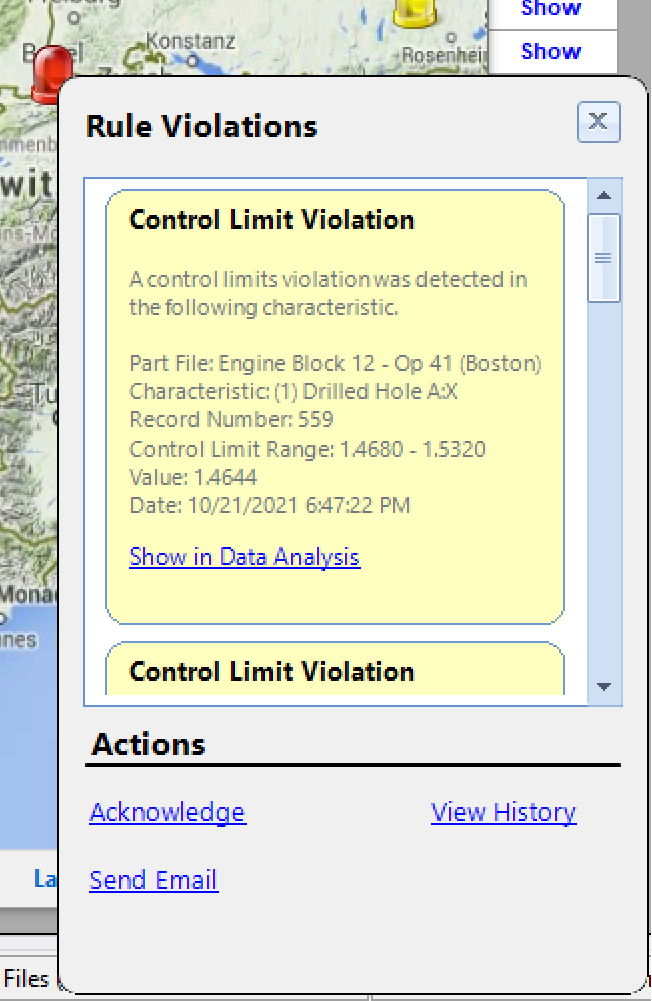
Interactive Hotspots
When an issue occurs and a light begins flashing, it can be selected to perform other actions such as acknowledging the issue, running an analysis of the problem data, or emailing a colleague.
Sticky Hotspots
Hotspots can be set to either flash only while a trend is occurring or continue flashing until manual acknowledgement. Setting them to continue flashing prevents missing a trend when the data improves. When disabled, hotspots will only flash as long as the data is showing trend exceptions. If the data improves, the lights return to green. Keeping this feature disabled is more appropriate when displaying full views on an overhead monitor where it is not possible to acknowledge every exception.