
March 2007 Newsletter
Latest News |
|||
|
|||
|
|||
|
|||
Spotlight: Process Toolbox
Prolink is pleased to announce a new strategic
partnership with Becker Quality Solutions, Inc. to take quality to the next
level. Becker Quality Solutions' new Process Toolbox combines measurement
data from QC-CALC with engineering knowledge to produce very specific operator
instructions that are easily executed.
How It Works
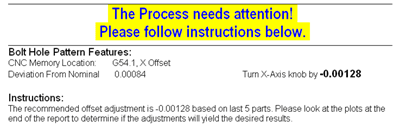
The process engineer enters all the typical problems that can cause a failure in his specific process into the Process Toolbox Editor. With each issue that is entered, the engineer builds in the solution to the issue using a combination of messages and calculations. The Process Toolbox Viewer then runs in the background collecting output data from QC-CALC and watching for patterns within the data. When a problem is detected, the operator is immediately notified allowing them to fix a potential issue before it leads to scrap. It's literally like having your best process engineer present 24 hours a day.
 Next Steps
How It Works
The process engineer enters all the typical problems that can cause a failure in his specific process into the Process Toolbox Editor. With each issue that is entered, the engineer builds in the solution to the issue using a combination of messages and calculations. The Process Toolbox Viewer then runs in the background collecting output data from QC-CALC and watching for patterns within the data. When a problem is detected, the operator is immediately notified allowing them to fix a potential issue before it leads to scrap. It's literally like having your best process engineer present 24 hours a day.

We can easily set up live
demos with any customers or distributors who are interested in getting more
details about the Process Toolbox. Please read our white paper entitled
Integrating QC-CALC and Process Toolbox or visit
www.BeckerQualitySolutions.com for more
information.
Tips & Tricks: Get Calculations Such As Cpk On
Subsets Of Data Without Filters Or Reports
This month's tip is an easy way of getting calculations
on your inspection data using the Point Properties window in QC-CALC Real-Time.
For instance, let's say your process is going well, but then the measurements
start to become erratic. In this case, you will certainly want to fix your
process, but you may also want to see how you were doing just before the data
started to change.
How To Do It
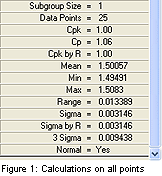
1. Start by making sure your Point Properties window is visible. You can do this by clicking Window > Point Properties. Scroll to the bottom of the Point Properties window so the calculations are visible. The following two pictures show a sample plot and the corresponding section of the Point Properties window containing the Cpk and Cpk by R.
 |
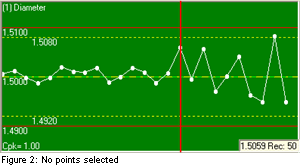 |
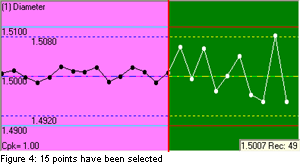
2. Now highlight a set of points by clicking the plot with your left mouse
button and dragging the selection across the points you wish to include in your
calculations. When finished, release the button. Notice that the Point
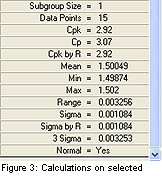
Properties window has changed. In our example, the Data Points value is now 15
and the Cpk is 2.92. This is because all calculations in the Point Properties
window are based on the currently selected points. If none are selected, the
calculation is based on all visible points.
 |
 |
3. With the points still selected, move your mouse from
plot to plot in the window. You'll notice that the selection follows your mouse
until you click the mouse button again. Likewise, the calculations will change
each time you move to a new plot. You can also run reports on your selected
points by choosing Report > Print Report and choosing Selected
Points in the Range of Records to Report section.
Thanks!