|
Press Release: Gene VanPatten to Head Sales at Prolink
Prolink is excited to announce the appointment of Gene VanPatten as the new Director of Sales. Gene brings over 30 years of experience in the quality industry
and has extensive experience in Statistical Process Control software. His experience includes many years at GageTalker, VisualSPC, GE Fanuc, and most recently, Nikon Metrology. We
are sure that Gene will be a valuable asset to the Prolink team and look forward to a long and successful partnership with him.
|
|
Prolink to exhibit at Quality Expo South
Come visit us in Booth 805 at the 2012 Quality Expo in Fort Worth, TX! We'll have a Renishaw Equator, RAM Optical Vision Machine, MicroRidge Wireless Gaging, and an Allen Bradley PLC in the booth collecting data.
Fort Worth Convention Center
Fort Worth, TX
March 14-15, 2012
|
|
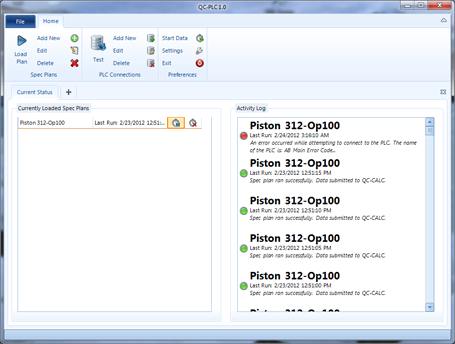
Product Spotlight: New QC-PLC now available in beta!!
Prolink is proud to report that it continues to add to the vision of universal data
collection by creating a new product called QC-PLC. Like the name implies, QC-PLC
has been developed to collect process and part data from over 95% of the most commonly
used ethernet connected programmable logic controllers on the market. Brands include
Allen Bradley, Siemens,
GE Fanuc, and Modbus (ethernet and RS-232).
|
Here is a list of some of the available features.
- Easily setup spec plans just like QC-Gage to collect data on either a timed interval
or event trigger in your ladder logic.
- Create monitors to watch the data in real-time with meters or line charts.
- Run it as an application or unattended as a Windows Service.
- Notify administrators via email when problems arise.
How To Get It:
Contact Jason Brigham at Prolink to be one of the first to try this new data collection
tool.
|
 |
|
|
Tip: Create a Dashboard Slideshow using multiple dashboards
One really slick feature of the dashboards in ERS is that they can be exported to
image files as they refresh themselves. This allows you to post and continually
refresh them on your internal department or plant website, or even display them on large LCD panels around the shop floor. However,
since you may have several dashboards you want to display, you will want to put them into a continuous slideshow showing each one for 10-15 seconds
before flipping to the next one.
In December, we posted an article in our Knowledge Base (link is below) explaining
how to do this with a sample HTML page that you can use for your dashboard. With
a couple of quick changes to the sample file using Notepad, you can get the slideshow
to work immediately. Please see our Knowledge Base article for full details and to download the sample page, but below are the steps paraphrased.
Creating a slideshow with ERS dashboards
How To Do It (paraphrased):
- Create your dashboards in the Enterprise Report Scheduler and set them to export
to a location on your webserver where you can access them using an http:// path.
Your IT department can help with this if you don't know what this is.
- Download the sample HTML file from the article and open it in Notepad.
- In the sample file, change the paths of the images in the sample HTML file to
your image paths created in step 1.
- Adjust the timing if desired. For example, every 5 seconds, etc.
- Save the file with a .htm extension.
- Open Internet Explorer on the PC where you want to show the slideshow and open
the sample file in the browser.
That's it. The script inside the file will automatically rotate between the images
you were creating.
|
How to Get It:
Download the latest version of the Enterprise Report Scheduler 3.3.
Want to Learn More?
Download ERS 3.3 Now >>
|
|
