|
Prolink to exhibit at the Quality Expo 2009
Booth: 4615
September 22-24, 2009
Donald E. Stephens Convention Center
Rosemont, IL
Come visit us to see the latest improvements!! |
|
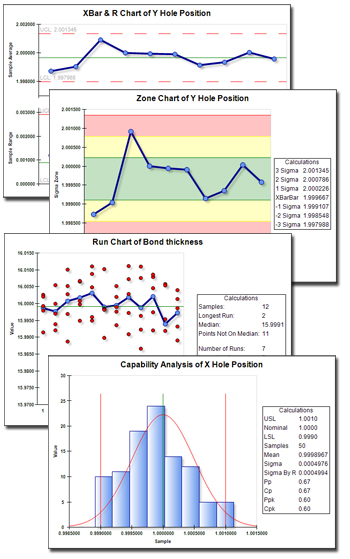
Product Spotlight: New Charting in the SPC Office Buddy
Prolink is proud to announce release of the new Prolink Charting package for use with the
SPC Office Buddy. This new charting package is perfect for creating SPC charts and
statistics on the fly or for use in your Excel spreadsheets.
|
The following are just a few of the new features in the Prolink Charting package.
- Full color charts with relevant calculations for all currently available Buddy charts
- Ability to right click and copy chart images into your other documents, Powerpoint
presentations, etc.
- Full support for Excel Jobs allowing you to automatically place the charts into
your custom Excel reports.
- Ability to add literal calculation values into your Excel reports with or without
displaying a chart.
This includes support for all major statistical calculations such as Mean, Min,
Max, Range, Cp, Cpk, Pp, Ppk, Sigma, Control limits, SigmaByR, and more.
- Gage R&R capability along with Gage R&R calculations. This includes Part
Variation (PV), Repeatability(EV), Reproducibility(AV) and Total GR&R.
How To Get It:
Download the latest version of the SPC Office Buddy 3.2 and it will be installed
automatically. If you already have the SPC Office Buddy 3.2, please download the
latest full version and install it over your existing copy. There will be no effect
on your existing license.
To use it, simply go to Tools > Options > Chart Settings
and choose Prolink Charting from the Chart Tool list.
If you have not purchased the Prolink Charting option, the charts will have watermarks
and a screen that reminds you to purchase will appear. Once licensed, this will stop.
Want to Learn More?
View the SPC Office Buddy Product Page >>
View the Prolink Charting Feature Page >>
|
 |
|
|
Tip: Delay your measurement in QC-Gage 3.2??
We have been asked about this a few times so we finally added it to QC-Gage 3.2.
When you're collecting data in QC-Gage, a picture of the plot with historical measurements
is shown on the data entry screen. This is useful if you are looking at the past
measurements, but what if you want to look at the measurement you just took? It
typically happens so quickly
that the focus moves to the next measurement before
you get a chance to see how the plot looked when you took the measurement. To allow
you to see the results, we have introduced an option to allow you to delay the screen
x seconds before moving to the next measurement. This gives you a little time to
see your measurement without having to backtrack.
|
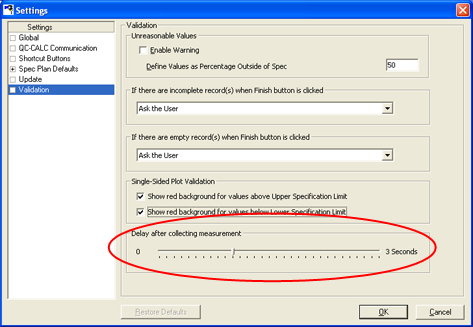
How To Do It:
- In QC-Gage 3.2, go to Tools > Options > Validation.
- At the bottom of the screen, use the slider to select an amount of time to delay.
The range is 0-3 seconds.
- Click OK.
When you measure your parts, you will notice that after the measurement occurs,
the
screen will then delay for the time specified and allowing you to look at the plot
before proceeding.
|
|
How to Get It:
If you have QC-Gage 3.2, all you need to do is click Help >
Run Update or download the latest update from our website.
If you have an earlier version of QC-Gage, then it's a great time to upgrade and
take advantage of all the new features in QC-Gage 3.2. You can download version
3.2 and install it into a different folder to try it out before upgrading since
multiple versions can coexist.
Want to Learn More?
Download QC-Gage
3.2 Now >>
|
|