|
Product Spotlight: Enterprise Report 3.4 with Full View!
Prolink is pleased to announce that the Enterprise Report Scheduler 3.4 was released and boasts a new feature called Full View.
 |
|
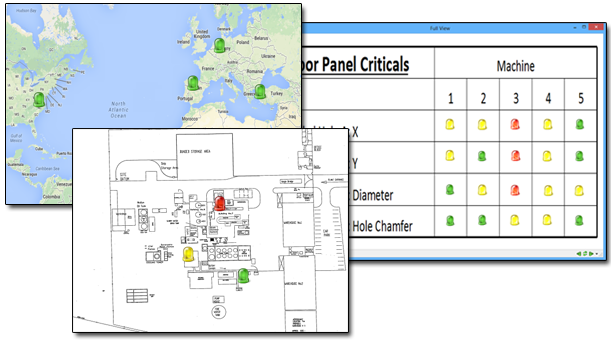
Full View allows you to place hotspots (lights) over any background image (typically a shop floor map). The hotspots can then be linked to actual data and evaluated against trend rules, or be linked to another full view.
- Link multiple full views to each other creating a summary view with drill through capability.
- Find not just the issue, but the location of the issue with blinking lights on your map.
- Click the blinking lights for more options and immediate analysis based on the data that caused the trend.
- Email colleagues when an issue occurs in their work cell.
- Never miss a problem while you're away with sticky hotspots.
|
How to Get It:
Download ERS 3.4 >>
Want to Learn More?
Sign Up for a Live Demo >>
|
|
Prolink to Exhibit at IMTS 2014
Prolink will be showing all our latest software in booth E-5415 in the East (Lakeshore) Building all week. If you plan to be at the show, please stop by and see us.
See our Exhibitor Profile
IMTS - McCormick Place
Chicago, IL
Sept. 8-13, 2014
Building: East (Lakeshore)
Booth: E-5415
|
|
Tip: Using the Latest Value filter in ERS
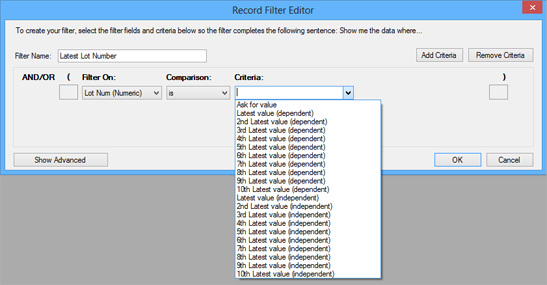
This feature was added to allow grouping and flexibility to ERS analysis and reporting. Just like QC-CALC which allows you to filter your data based on the latest value of a factor, ERS
has this same ability. However, to take things a bit further, you can actually filter on the last 10 latest values. To make it more interesting, you can filter on the
latest values either dependently or independently of other filters and/or criteria.
For instance, let's say you have a filter that gets all the data from last month and you would also like
to filter based on lot number, but you don't know the lots that were produced last month. If you choose the Latest Value (dependent) for Lot number, then ERS will automatically
return the data based on the latest lot number from last month. This is because you chose the latest value (dependent) which tells ERS that the latest lot number is dependent on other criteria
in your filter (in this case "Last Month"). As such, it first gets data for last month, finds the latest lot number, and then filters the data by both criteria.
If you choose the Latest Value (independent), ERS will first find the latest lot number ever (regardless of date) and then
attempt to filter data for that lot number and data that occurred last month. This is because you are telling ERS to find the latest lot number independently of other filters or criteria.
If you have no other criteria in your filter, then it doesn't matter whether you choose the dependent or independent versions
of the latest value filters. If there is nothing else to depend on, then they will return the same answer. However, if you are using a global
filter in an analysis, dashboard, etc and you are using a dependent latest value filter, it will automatically depend on the global filter's criteria. This
makes creating flexible reports very easy.
In addition, you don't need to use a month filter. If you wanted to know the latest lot that was produced on a particular machine, you could add criteria that
filtered on Machine 2 (for example) and then choose the latest lot number dependent.
Another benefit of this feature is its ability to go back up to 10 latest values. Continuing with the example above and that you don't know the latest
lot number from last month, let's say you wanted a report that showed the latest 5 lots and compared them. All you need to do is create 5 filters each using
the latest value, 2nd latest value, 3rd latest value, and so forth. When you add them to your data group and run your report, you'll always get the latest 5 lots. If you use
a global filter such as last month and make the latest filters dependent, then it will always return the latest 5 lots' data for last month.
Of course the next thing that needs to be done is to display the lot number that was found on the report/chart. Fortunately ERS has a solution for that as well.
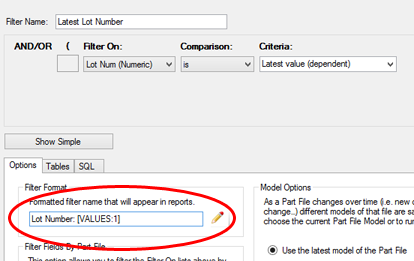
If you open up the Advanced view and add the [Values:1] command, you can display the value for any of the criteria in the filter. The command is substituted with actual data whenever the
filter is run. The substitution will occur anywhere you run the filter including Analysis charts, report, dashboards, export, and full views. The 1 in this case tells ERS you want to display
the value for the 1st criteria which is the latest lot number.
Keep in mind you can construct any label you want. In our example, we added "Lot Number: " in front of the value.
You could also create interesting labels such as "My data as of [Value:1] from lot [Value:2]". The assumption in this example is the first criteria is some date based criteria and the
second returns a lot number.
|
How to Get It:
Download ERS 3.4 >>
Want to Learn More?
Sign up for a live Demo >>
|
|
