September 2007 Newsletter
Latest News |
|||
|
|||
|
|||
Spotlight: Direct Output to StatGraphics
Centurion XV
QC-CALC Real-Time 3.0 now has the ability to export
directly to StatGraphics Centurion XV when installed on the same PC. As with
our other SPC outputs, QC-CALC doesn't just output the results to a file to be
imported into StatGraphics. It actually launches StatGraphics and places the
results directly in a table.
How It Works
Simply export your QC-CALC data the same way you normally do any other export. In the export type drop down list, choose StatGraphics Centurion. When you click the Export button, StatGraphics will appear with all data loaded. It doesn't get any easier.
Next Steps
If you have QC-CALC Real-Time 3.0, you don't need to purchase anything. Just update your software via the Help > Run Update menu. Once you have updated to 3.0.240 or above, the new StatGraphics export will be available.
Prolink To Present QMD implementation at Quality Expo 2007
QC-CALC now supports the new AIAG QMD standard for both
import and export. Specifically, we have implemented ClassOne, ClassTwo, and
ClassThree. Prolink will be presenting and giving demos at the AIAG booth at
the Quality Expo if you would like to stop by and see it in action.
| Booth Info: AIAG Booth: 6952, 6954 Quality Expo September 25-27, 2007 Donald E. Stephen Convention Center Rosemont, IL (adjacent to O'Hare Airport) QMD Presentations: 11am and 2pm |
Tips & Tricks: Calculating Control Limits - At The Dimension Level, Part Level and More...
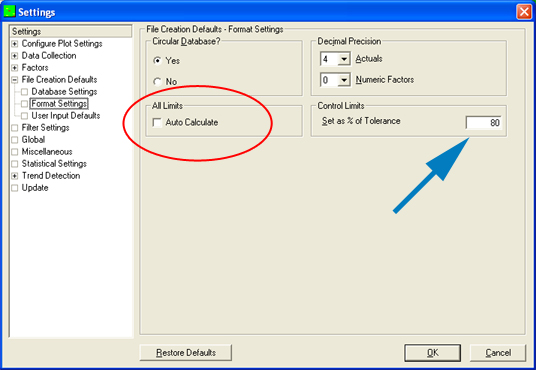
By default, QC-CALC Real-Time sets the control limits at
80% of the tolerance when a new QCC file is created (the first part of any new
inspection routine is run). This is done because there isn't enough data to
statistically calculate the control limits when a new file is created.
Therefore, setting them to 80% becomes more of an early warning system rather
than a true control chart.
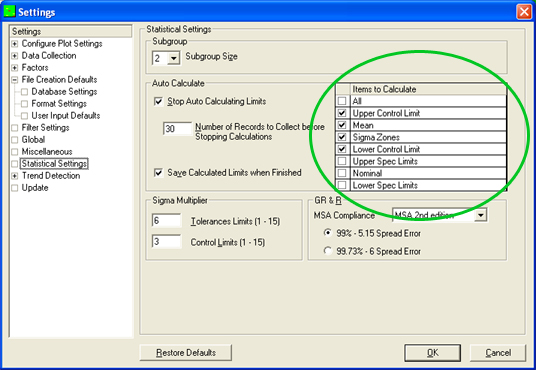
The good news is that you have several options for
calculating control limits as well as other limits.
I'll go through the most common here:
I'll go through the most common here:
|
|
Thanks!