|
We've already started to see demand for the new SPC Office Buddy, but we really
want it to catch on as the best solution for producing Excel reports. As such, we
will be giving away the SPC Office Buddy v.3.2 during the week of September 14-20th,
2008. This is a limited time offer and there is a limit of one free Buddy per company,
so don't miss out. This is a fully licensed Buddy that will not expire and we've
made it easy to obtain via our website.
How To Get It
Simply visit http://www.SPCOfficeBuddy.com/FREE next week and follow
the instructions. The wizard will lead you through registration, download, and activation.
Want To Know What's Coming?
We'd like to hear from you. Tell us how the Buddy
has helped your process and what you feel would make it even better.
We're already
working on new features such as:
- Adding subgrouping to the Minitab reports so you'll be able to automatically subgroup within your Excel Jobs.
- Creating Macros that would allow you to run multiple jobs in one large job.
Interested in seeing a quick demo?
This short video shows a couple of example reports we've received from customers and how we automated them with the SPC Office Buddy.
View 3 Minute Excel Jobs Intro Video
Would you like to see how easy it is to use?
This slightly longer video takes you through the creation of a simple template and Excel Job.
View 6 Minute Excel Jobs Getting Started Video
|
|
Come Visit Prolink at IMTS in Chicago!!
Prolink will be on display in booth D-4635 in the Lakeside East building
of IMTS. We're in the quality pavilion so you can't miss us.
There will be live FARO arm and MicroRidge Gageway
wireless data collection along with interactive demos of all major exports, the Buddy, and new enterprise database
level reporting.
| When: |
Sept 8 - 13, 2008 |
| Where: |
Lakeside East Booth #4635
McCormick Place
Chicago, IL |
|
|
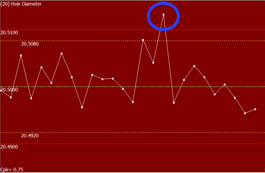
Tips & Tricks: Increase the Number of Points to Determine Plot Color
We often hear from customers who measure a high volume of parts and sometimes miss the yellow or red plot changes if
they aren't paying attention to QC-CALC when a part goes out of control or spec.
There are several remedies to this situation including
automatic reporting or trend detection with email, but today I wanted to focus on an easy way to tell QC-CALC how many
points to use to determine the color of the plot. For instance, if you tell QC-CALC to use 10 points to determine the plot color, if any of the last
10 parts have a bad measurement, the plot will turn red. This way, you have a longer opportunity to notice the issue and fix it.
In the example at the right, the 10th point back in history is out of spec and the
plot has turned red even though points since are in tolerance. |
 |
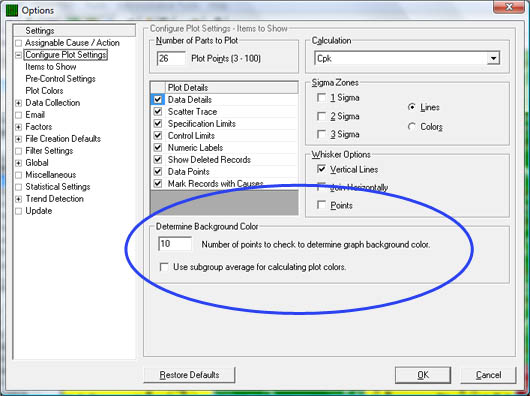
How To Do It
- Go to Tools > Options > Configure Plot Settings > Items To Show.
- Type the number of points in the Determine Background Color section.
- Optionally specify using the subgroup average to determine the plot color.
- Click OK. QC-CALC will now change the background color according
to your setting.
|
 |
|