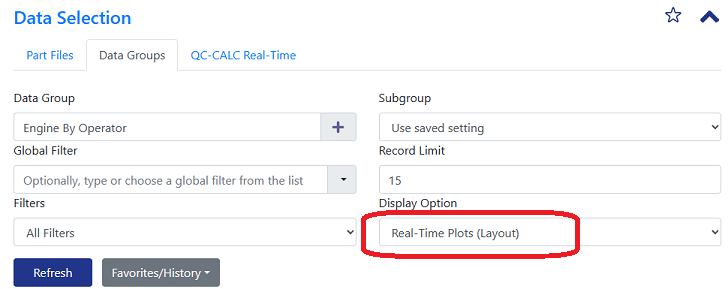
A relatively new feature in QC-Mobile 4.2's Live Data screen is the new Layout view. It's very similar to plot view but offers the ability to drag and drop the different sets of plots rather than have them as buttons with slide show. To use the new feature, simply choose
Real-Time Plots (Layout) from the Display Type when viewing data on the Live Data screen. While it's useful for the Part File tab, it has more relevance on the Data Group tab because it will create a panel of plots for each record filter grouping in the data group chosen.
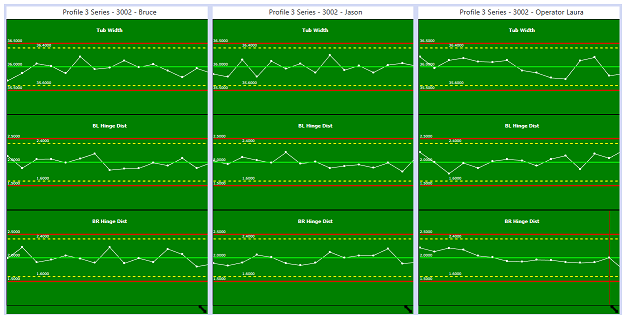
By default, a panel of plots will be created for each record filter and will be displayed on the screen. In the bottom right corner of each panel, there is a double arrow indicating the panel can be resized. Resize by clicking and dragging the panel to different shapes. The panel can also be dragged to a new location on the screen by clicking and dragging near the top of the panel.
Plots inside the panels will automatically resize to fit the available space. This offers a big advantage over regular Real-Time Plots view because many more plots can be displayed and monitored on the screen.
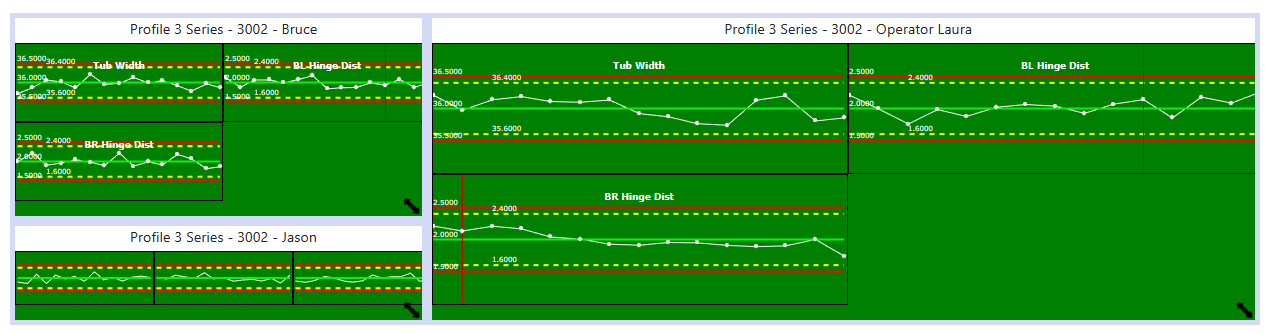
The following image shows a custom layout upon changing the size and location of the panels.
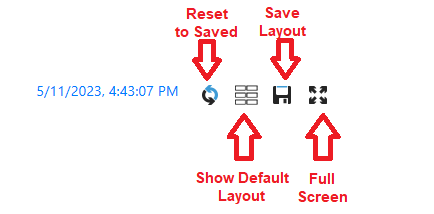
In the upper right corner of the panels, there is a row of buttons allowing a toggle of views and for the layout to be saved. Upon saving the layout, it will be remembered automatically for the current user and datagroup. To set it back to default, click the default layout button and save that layout.