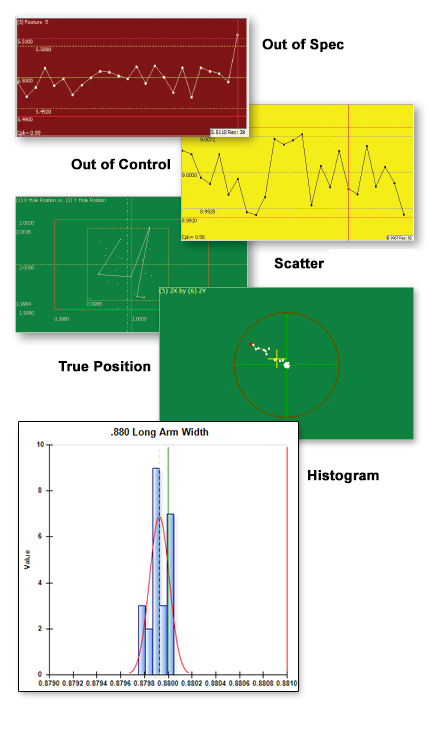
QC-CALC Real-Time's on-screen plots enable you to keep tabs on your process with a single glance. The background color of each plot indicates the condition of the last part received for each dimension. A red plot indicates the last point was out of specification (tolerance), yellow indicates out of control, and green indicates the last point was in control. The color can also be set to change the color based on the worst of the last x features which can be useful when dealing with multi-part fixtures.
Colors in the plots also indicate edited and deleted points as well as trend conditions (purple).
Multiple Plot Types
In addition to the standard control charts, you can add range charts (for XBar & R), combine multiple features to show a scatter plot (shown on right), or use multiple parts to create a whisker chart.
Displayed Calculation
Need to know the current Cpk? Put it right on the charts. The plots allow you to place the calculation of your choice in the lower left hand corner. Other calculation options include Average, Average and Range, Cp, Cpk By R, Cmk, Range, Sigma, ZUpper and ZLower, and the last value collected.
Popup Menu
The popup menu allows you to right click on any point and remeasure the part, delete/undelete the part or point, assign an assignable cause or corrective action, edit the point, calculate the control limits, print a report, and change the displayed calculation.
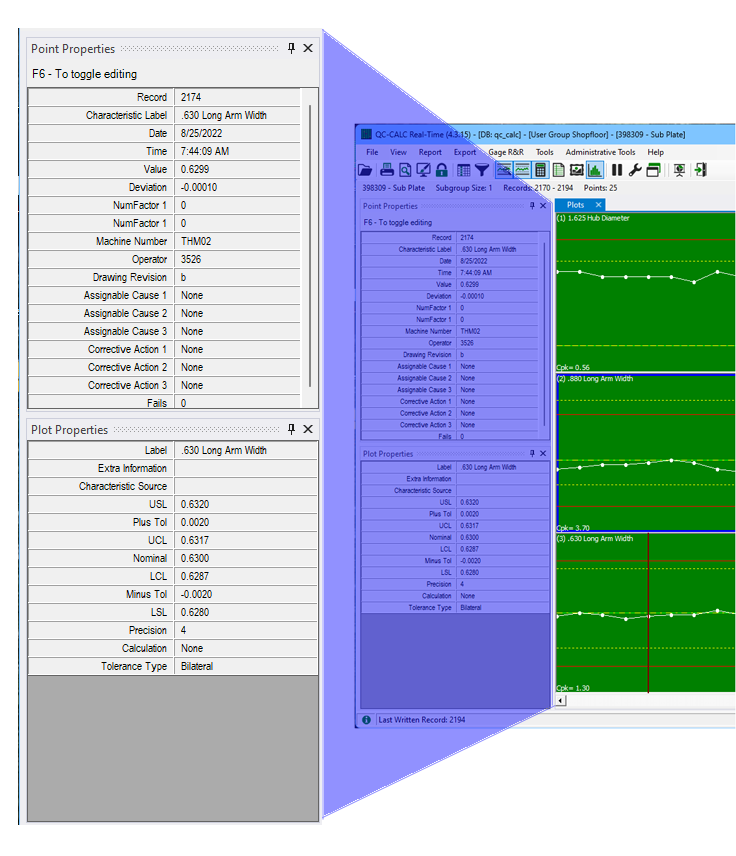
Point & Plot Properties and QuickStats
Each plot contains many points and each point has many properties. With the click of a button, point and plot information is available in a panel on the left side of the screen (shown at right).
The Quick Stats panel shows live calculations as the data is collected. In addition, if you highlight only certain points, it will automatically re-calculate based on just the highlighted points.
Trace Fields
Extra non-measurement data can be automatically collected from the machine and are viewable on the Point Properties screen. Collecting extra non-measurement data such as the inspector, shift, cavity, lot number, etc can be useful later if you want to filter your data and run reports on just certain portions to observe trends.
Assignable Causes and Corrective Actions
Assignable Causes and Corrective Actions are added by right-clicking on a specific data point in a plot, then viewed on the Point Properties screen.