In QC-CALC Real-Time, you can optionally enable a true position plot. When you do so, you specify 4 dimensions that will make up the plot. These are the X, Y, Diameter (hole or pin), and true position values from the measurement equipment. Once the 4 dimensions are grouped, the plot will automatically switch to the plots you see on the right.
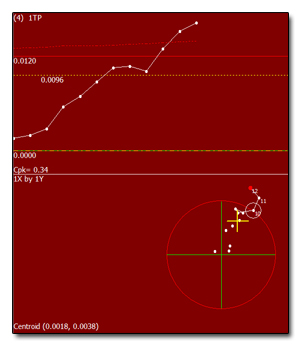
The top half of the plot has a single sided upper dimension showing the true position. This plot displays both the RFS tolerance line (solid red) and the MMC bonus tolerance line (dotted red). The bonus tolerance will automatically be calculated for each part.
The bottom half of the chart shows a bulls eye chart showing the true position relative to the target. The last 5 parts are connected so you can see the direction. In addition, there is a large yellow cross indicating the centroid.
Finally, if the part can be bought on the bonus, a circle is drawn around the dot intersecting with the RFS tolerance circle. This indicates that although the position was out of tolerance, it was bought on bonus. Parts that are out of bonus are simply drawn outside the tolerance ring and are not circled.
In addition to the visual display, all statistics calculations including Cp and Cpk are calculated taking the moving bonus tolerance into account.