True Position Charting
QC-CALC SPC Pro combines normal True Position charting with a first in the industry 3 dimensional True Position chart.
The normal True Position is a combination of two charts stacked (shown to the right). The top chart shows the linear time based true position feature plotted against both RFS (regardless of feature size) tolerance and a bonus (max or min material size). This relationship information is taken directly from QC-CALC and the MMC bonus is automatically calculated for you in the chart.
The bottom chart is a positional chart showing an XY scatter plot (bulls eye). The XY shows the position of the various points vs. the target. The centroid of the data is marked by a green plus sign and the last 5 values are connected by a line showing you the general direction of the position. Parts that are outside RFS tolerance, but have been bought on bonus are shown by drawing the bonus circle (small red ring) around the point that intersects the main RFS tolerance ring.
Unfortunately, in certain cases where the points are very close to each other, it can be hard to see trends within the data flow.
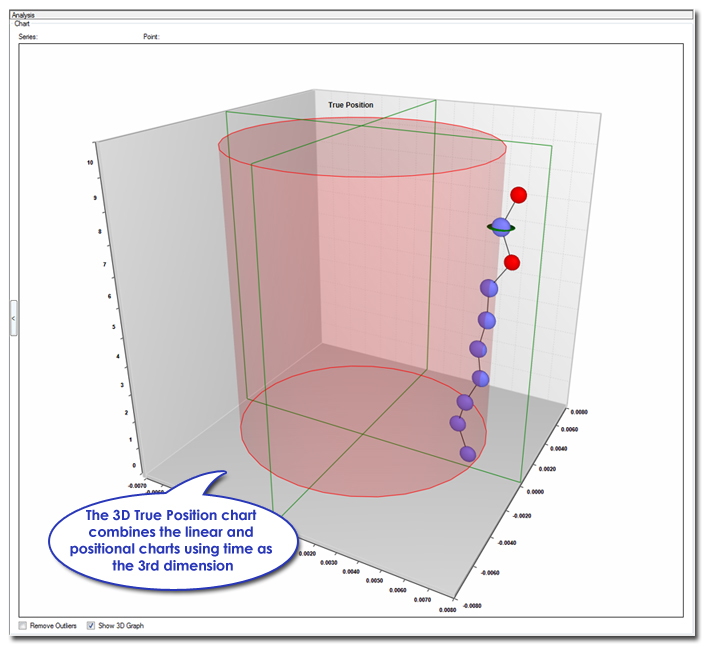
3D True Position Chart
For parts
that are close together in the standard True Position chart above,
Prolink has created the first of its kind 3D True Position Chart. The 3D
True Position chart (shown to the left) combines the time-based linear chart with the
positional scatter plot and uses time as the 3rd dimension.
The
chart to the left shows the same exact data as the chart above. The
parts are ordered in time from bottom to top with the top point being
the latest point. Where points are out of tolerance, they are shown in
red. Points that are bought on bonus have the bonus ring encircling them
in green (see second point from top).
Not only is this chart
displayed in 3D, it is movable in 3D space by dragging your mouse and
turning the chart to get a better view. You can also reposition and zoom in on the chart.
The power of this chart is its ability to show the trend of the true positions over time when they are close together.