Summary of Process Capability Report
The
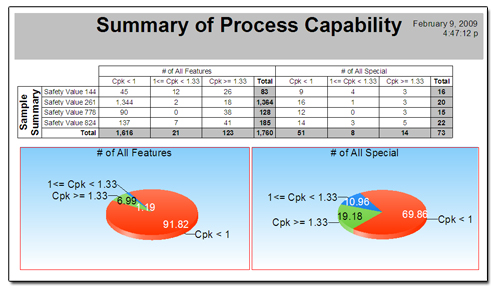
Summary of Process Capability report groups the Cpk’s of all chosen
features (including a breakout of specials or criticals) into three
user-defined buckets according to value. This allows management to
quickly see which parts are the worst performers both within the
critical dimensions and overall. Pie charts under each grouping quickly
show the breakdown visually.
The example to the right shows a Summary report for the demo group with 1,760
overall features and 73 criticals.
|
|