One of the more compelling features that was added to the SPC Office Buddy was the ability to handle non-normal dimensions. These include most single-sided dimensions (such as flatness or perpendicularity) as well as bilateral dimensions where your data is skewed. In order to illustrate the feature, let's take the example of a customer wanting to run a Sixpack in Minitab on a set of non-normal features. In the past, in order to run this in Minitab, you had to (1) import the data, (2) run an Individual Distribution Identification report, (3) look at the distribution fit results to find the largest P-Value, and then (4) run a non-normal Sixpack based on the distribution with the largest P-Value making sure to type the nominal and tolerances for your dimension. This process takes a few minutes per dimension, but what if you have 50-100 dimensions or more? It could take hours!
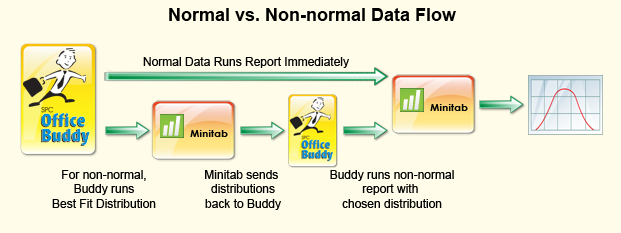
With this new ability the Buddy is smart enough to figure out your non-normal distribution for you. Using the same example above, all you have to do is highlight the dimension to run and tell the Buddy to run a Sixpack. The Buddy then runs an Individual Distribution ID report in Minitab with your highlighted data. Using special commands, the Buddy tells Minitab to output the results of the test and waits patiently for this to happen. Once Minitab is finished, the Buddy reads the results, determines the best distribution to use (optionally asking you for an override), and then runs Minitab a second time passing in the data, a command to run the non-normal Sixpack, and the distribution to use. All of this happens in seconds per dimension greatly reducing the amount of time it takes to run your reports. And rest assured, it works the same way with Excel Jobs as it does when you are just running a one-time chart.
Options in Buddy
In the Buddy, you can control how the Buddy deals with Non-Normal data via the non-normal data screen in
Tools > Options > Non-Normal Data. You can choose whether to transform the data using a Johnson Transform or to fit the data to a distribution. You can also choose whether you want to limit the distributions that will be compared. Finally, you can choose whether you want the Buddy to choose the best distribution for you or if you want it to present you with a list of choices for each dimension allowing you to choose the distribution yourself.