The default Raw Data reports with QC-CALC do not show any columns of factor values at the start. This White Paper will give step-by-step instructions for designing a custom template and adding a column of "Text Factor 1" values to one of the standard Raw Data templates.
The Report Designer
The directions shown here will replace the report's 10th column of dimension information with a value saved in Text Factor 1. This is a lengthy process, but relatively simple to accomplish.
- From QC-CALC Real-Time choose the Report – Design Template menu.
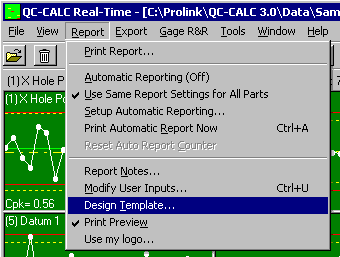
- Choose the DataStat.raw template from the list of files that appears and click Open.
- The Report Designer now appears on the screen.
- Double-click on the table and the Table Contents window will appear.
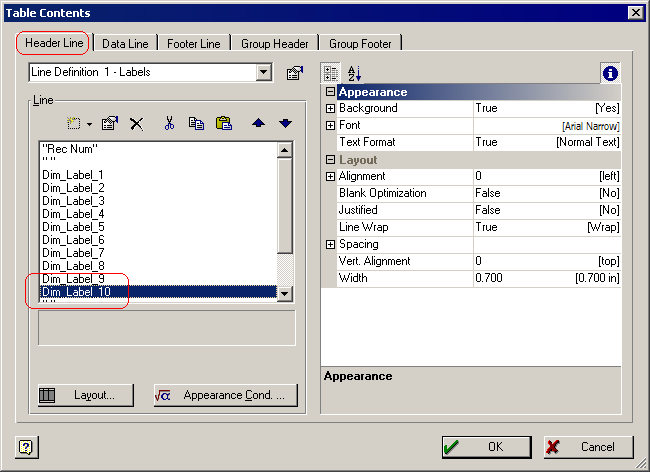
- Choose the Header Line tab, double-click the “Dim_Label_10” line in the Line area, and the Edit Table window appears.
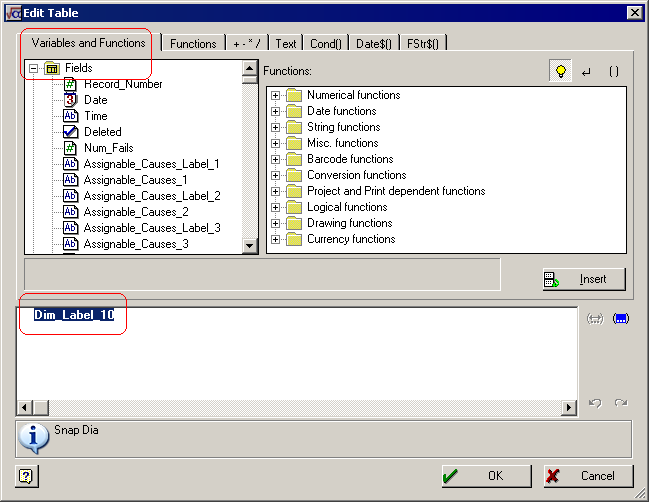
- Highlight the “Dim_Label_10” in the box at the bottom, then open the Fields list at the top of the screen.
- Scroll down the Fields list until you find the “Text_Factor_1_Label” item, highlight it, and click the Insert button to the right.

- Click the OK button on the Edit Table window.
- On the Table Contents window, choose the “Line Definition 2 – Nominal” item at the top of the Header Line tab.
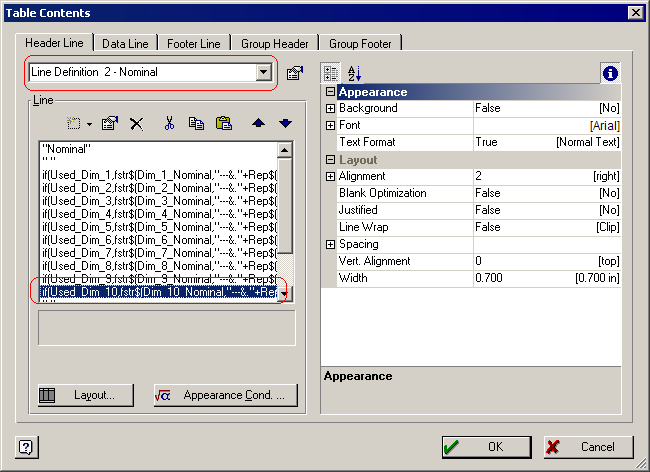
- Double-click the “if(Used_Dim_10,…” line to get to the Edit Table window for this line.
- In the Edit Table window, highlight and delete the entire “if(Used_Dim_10,…” line towards the bottom of the window, enter “ “ (quote space quote) in that area as shown below, then click OK.

- On the Table Contents screen, click the plus sign (+) to the left of Background in the Appearance area. Change the Background option to “True”, then choose “RGB(192,192,192)” for the Color.

- Follow steps 9 – 12 for the “Line Definition 3 – USL” and “Line Definition 4 – LSL” items.
Data Lines
- Still in the Table Contents window choose the Data Line tab, then double-click the “if(Used_Dim_10,…” line to get to the Edit Table window for this line.
- Delete everything in the box at the bottom, then scroll down in the Fields list a the top of the screen until you find the “Text_Factor_1” item.
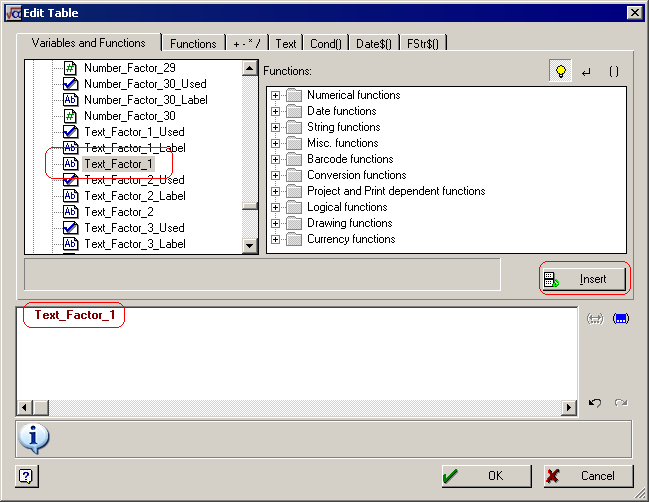
- Highlight “Text_Factor_1” in the Fields list, click the Insert button, and then click OK.
Footer Lines
- Back in the Table Contents window choose the Footer Line tab.
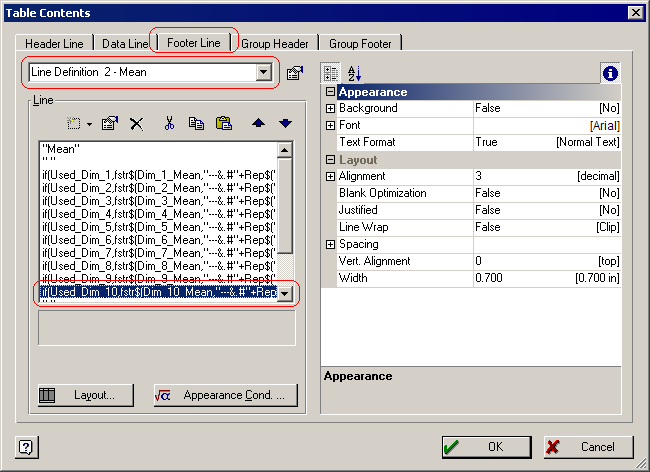
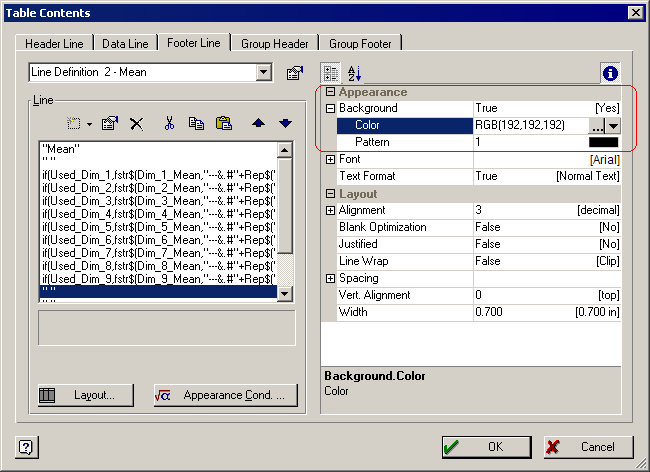
- Choose “Line Definition 2 – Mean” at the top of the screen then double-click the “if(Used_Dim_10,…” line to open the Edit Table window for this line.
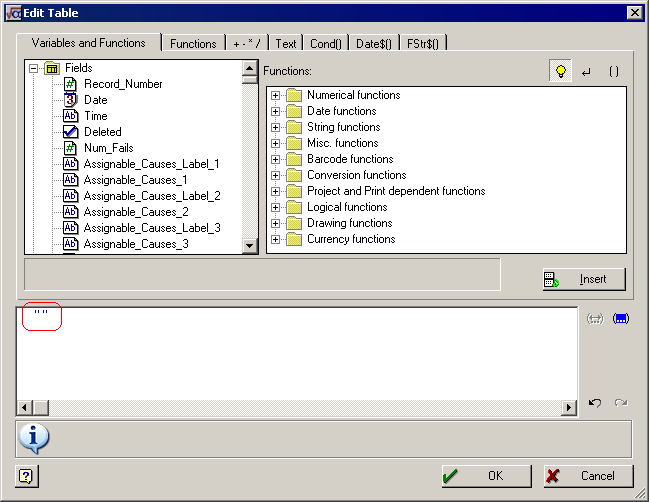
- In the Edit Table window, highlight and delete the entire “if(Used_Dim_10,…” line towards the bottom of the window, enter “ “ (quote space quote) in that area as shown below, then click OK.
- Back on the Table Contents screen, click the plus sign (+) to the left of Background in the Appearance area. Change the Background option to “True”, then choose “RGB(192,192,192)” for the Color.
- Follow steps 2 – 4 for the following items:
“Line Definition 3 – Max”
“Line Definition 4 – Min”
“Line Definition 5 – Range”
“Line Definition 6 – Sigma”
“Line Definition 7 – Cpk”
General Steps
- Click OK on the Table Contents screen and save your changes (File – Save).
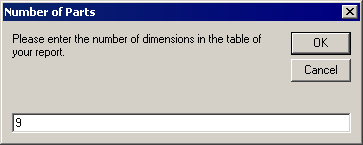
- Exit from the Report Designer and you will see a question asking if you changed the number of dimensions in your report. Choose Yes on this message.
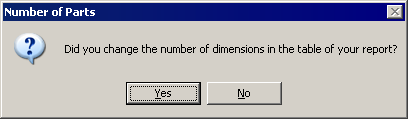
- The next window will ask for the total number of dimensions this report represents. Answer this question with “9” so that your report will run correctly in the future.