The default Raw Data reports that come with QC-CALC do not show any factor values in the report heading area. This is because the factor values should, in theory, be different for each row of the table, making it difficult to show any single value in the header. This White Paper will give step-by-step instructions for designing your own custom template and adding the Text Factor 1 value from the first record displayed to the header area of one of the standard Raw Data templates.
The Report Designer
The directions shown here will add Text Factor 1 (the value assigned to the first record in the table) to the report's header area. This is a lengthy process but relatively simple to accomplish.
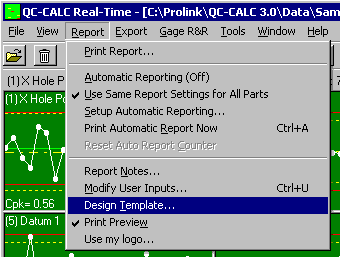
- From QC-CALC Real-Time, choose the Report – Design Template menu.
- Choose the "DataStat.raw" template from the list of files that appears and click Open.
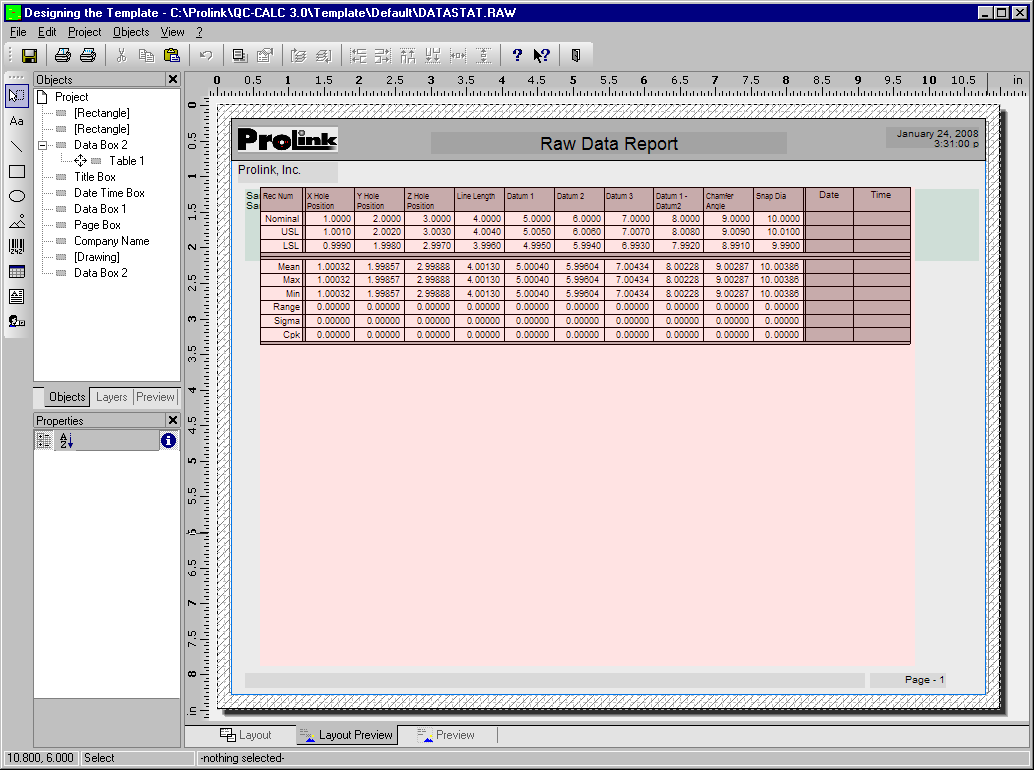
- The Report Designer now appears on the screen.
- In the Object List in the upper left corner (View – Windows – Object List if it is not visible), double-click on the “Data Box 2” object.
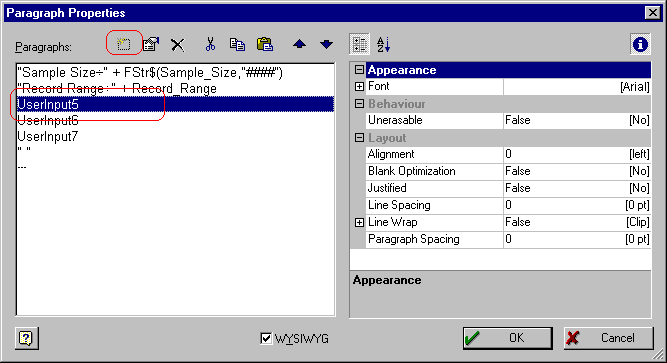
- The Paragraph Properties window is now displayed. Highlight the line you would like to have below the Text Factor line, which we will add, and click the Insert a Paragraph button.
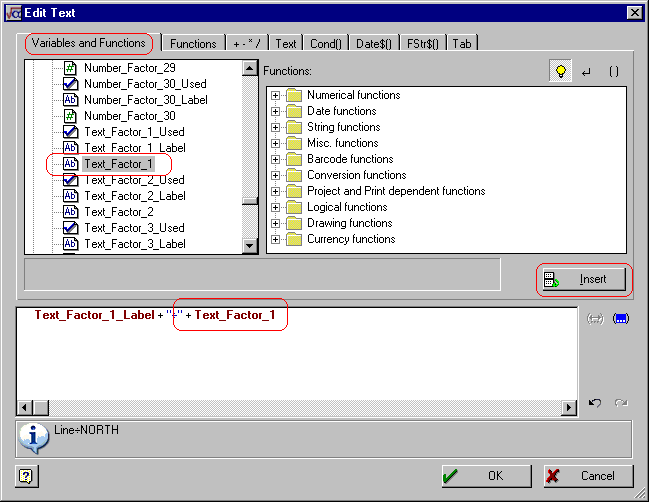
- In the Edit Text window that appears, choose “Text_Factor_1_Label” from the Variables and Functions tab area (it is a long way down in the list).
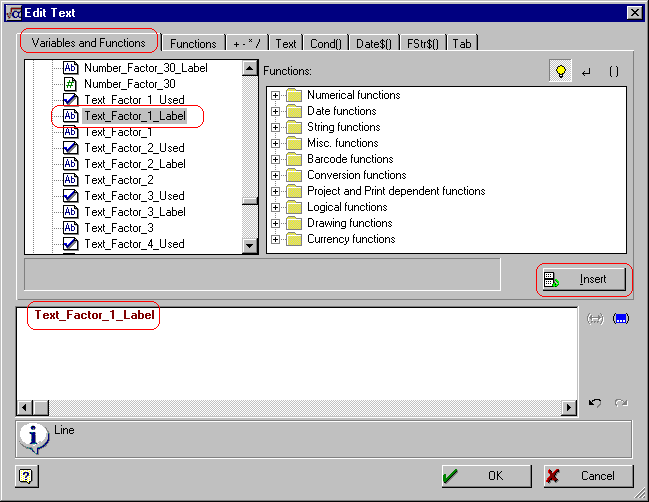
- Now click the Insert button. The variable you chose will be automatically moved to the bottom window.
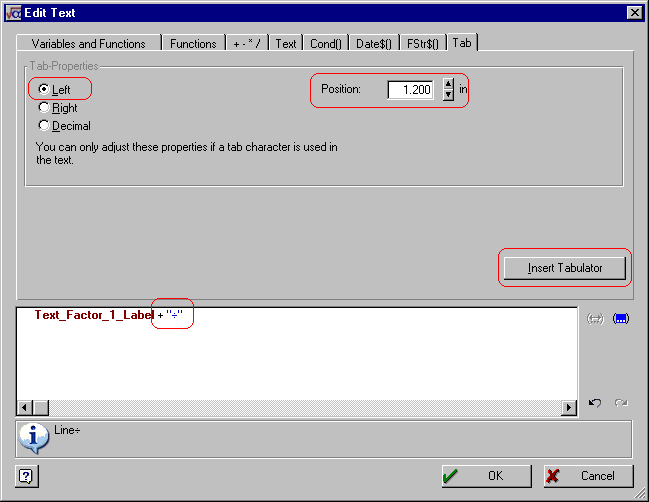
- Next, click on the Tab tab and click the Insert Tabulator button. This will concatenate a “÷” (tab) to the line.
- Now choose Left in the Tab-Properties area and set the Position to 1.20. To verify this value is correct and will line up with everything else, you can look at the Tab setting for one of the lines around where you inserted the new line.
- To insert the actual Text Factor 1 value into the line, return to the Variables and Functions tab, find the “Text_Factor_1” item in the list, and click the Insert button.
- Now click OK on the Edit Text and Paragraph Properties windows.
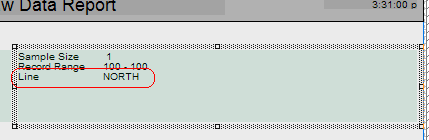
- When you look at the “Data Box 2” area of the Layout Preview screen, you should see the new line in the box. Make sure that all lines are still visible. You may need to stretch the window to get enough room for all lines to show.
Note: If you cannot see the “Data Box 2” because the red table is getting in the way, go to the Layers tab (in the same area as the Object List) and uncheck the “TableLayer.”
- Click File – Save, then File – Exit to get out of the Report Designer.
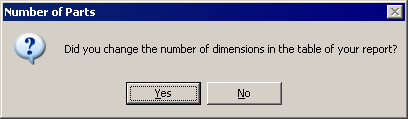
- As you Exit from the Report Designer, you will see a question asking if you have changed the number of dimensions in your report. Choose No.
- Now run your Raw Data report using the template you just changed.