A previous White Paper discussed having the Actual value rounded to the specified precision for that dimension before the testing for that value being Out of Specification. Once the testing of the Actual values is changed, the Reject Count that can be shown in the footer may no longer match the values shown in red (out of spec). This White Paper will give step-by-step instructions for adding the Reject count line in the footer and having those values based on Rounded values.
The Report Designer
The directions shown here will add a row to the footer where the number of fails for each dimension will be displayed and rounded values for the Actual will be tested when counting. This is a lengthy process, but relatively simple to accomplish.
- From QC-CALC Real-Time choose the Report – Design Template menu.
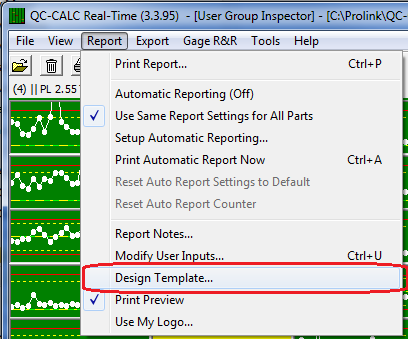
- Choose the DataStat.raw template from the list of files that appears and click Open.
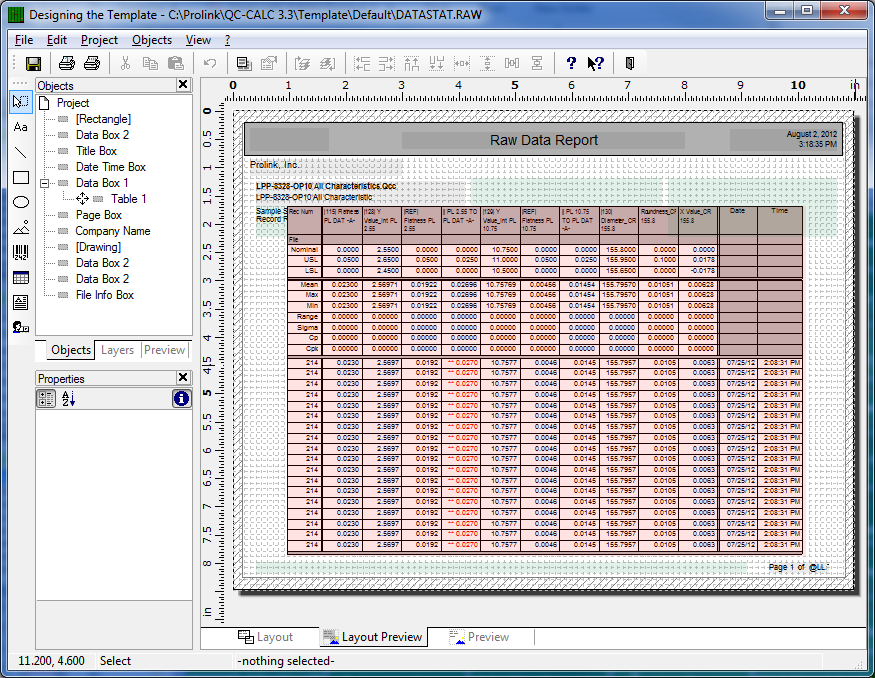
- The Report Designer now appears on the screen.
Adding Sum Variables
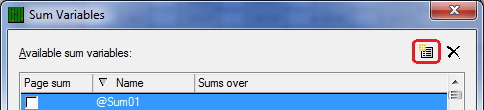
- In order to count the number of out of spec values within a dimension based on the rounded values the @Sum variables will need to be used. To set these up choose the Project – Sum Variables… menu and click the button shown in the picture below.
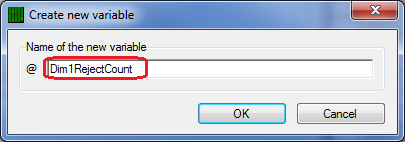
- On the next screen that appears enter “Dim1RejectCount” as the Name of the new variable and click OK.
- Back in the Sum Variables window highlight the “@Dim1RejectCount” line, then click the Edit button.
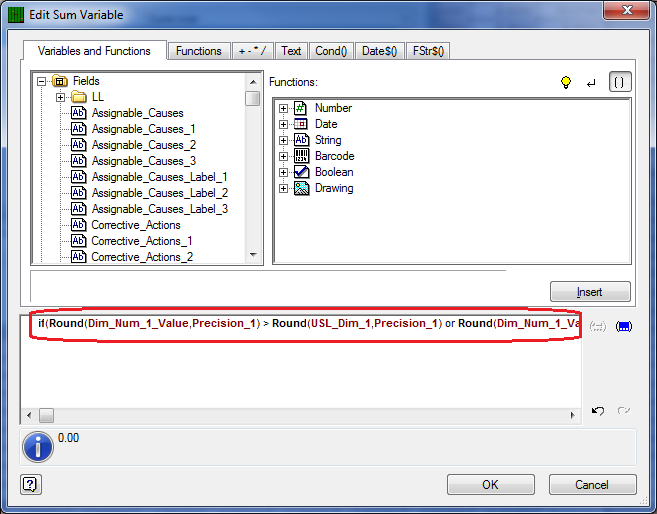
- In the Edit Sum Variable window you will need to build the test that will either add a 1 or a 0 to the variable for each row in the table. The formula to use for Dimension 1 testing is:
if(Round(Dim_Num_1_Value,Precision_1) > Round(USL_Dim_1,Precision_1) or Round(Dim_Num_1_Value,Precision_1) < Round(LSL_Dim_1,Precision_1),1,0)
- Repeat steps 4 through 7 for dimensions 2 through 10. Make sure you adjust the name (“@Dim2RejectCount”) and the formula for each dimension number. The formula for Dimension 2 should be:
if(Round(Dim_Num_2_Value,Precision_2) > Round(USL_Dim_2,Precision_2) or Round(Dim_Num_2_Value,Precision_2) < Round(LSL_Dim_2,Precision_2),1,0)
Adding the Footer Line
- Now that we have the @Sum variables all set up, the table needs to be modified to use those values and display the Rejected row in the footer.
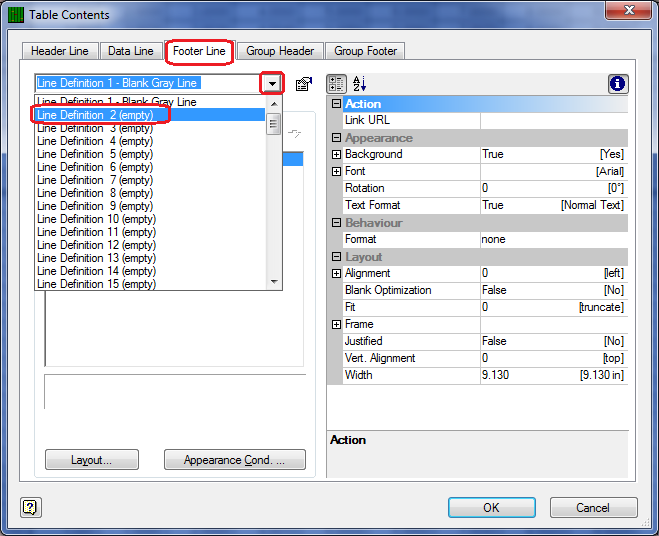
- Double-click on the table and the Table Contents window will appear. Choose the Footer Line tab, click on the down arrow right below the tab name, and choose the “Line Definition 2 (empty)” line.
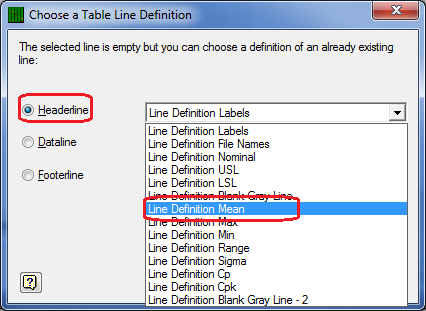
- With the next screen that appears you are going to specify which line definition you want to use as the basis for this new Footer Line definition. Choose Headerline and the “Line Definition Mean” line from the Headerline list.
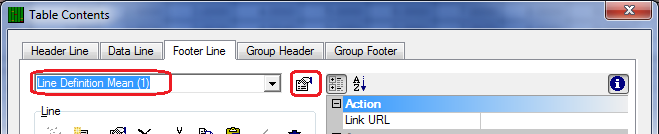
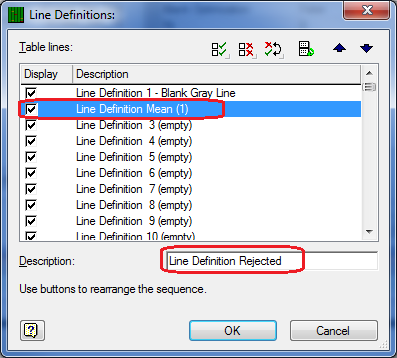
- Before going any further the name of the Footer Line that was just created needs to be changed. You will see the “Line Definition Mean (1)” name shown at the top of the screen. Click the button to the right of where the name is shown to bring up the Line Definitions screen.
- Choose the “Line Definition Mean (1)” line at the top of the screen and change the Description at the bottom to be “Line Definition Rejected” then click OK.
- Back on the Table Contents – Footer Line screen you will see that the name of the line being edited has changed to “Line Definition Rejected” so now we need to change the line over to show the reject count instead of the Mean it is displaying at the moment.
- Double-click on the “Mean” line on the left side of the screen and the Edit Table window appears. Change “Mean” to “Rejected” to change the label for that row in the table.
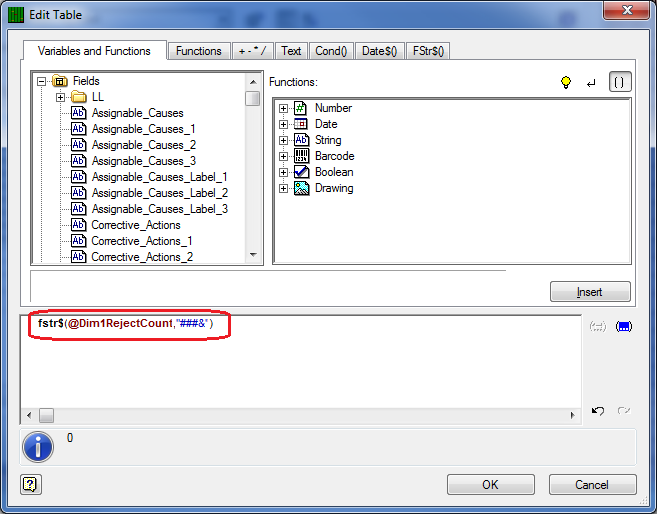
- Next double-click on the “if(Upper$(Dim_Source_1)=…” line. We are going to remove the formula to display the Mean and replace it with the values from the @Sum variables previously created. Replace the formula shown at the bottom of the Edit Table window with:
fstr$(@Dim1RejectCount,"###&")
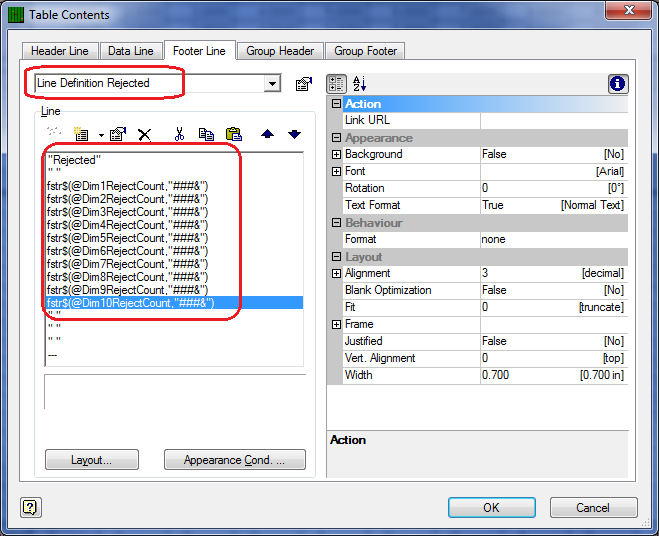
- Repeat step 16 for dimensions 2 through 10. The formula will change slightly for each dimension:
fstr$(@Dim2RejectCount,"###&")
- When you’ve finished the Table Contents – Footer Line screen should look like this:
- The last thing to be done is to copy the gray line between the data line section and the new footer line we just created and have that copy appear below the new line.
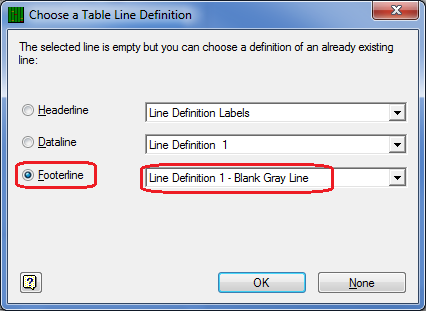
- In the Table Contents – Footer Line screen click on the down-arrow right below the tab name, and choose the “Line Definition 3 (empty)” line.
- With the next screen that appears you are going to specify which line definition you want to use as the basis for this new Footer Line definition. Choose Footerline and the “Line Definition 1 – Blank Gray Line” line from the Footerline list.
- You will see the “Line Definition 1 – Blank Gray Line (1)” name shown at the top of the screen. Click the button to the right of where the name is shown (like you did in step 12) to bring up the Line Definitions screen.
- Choose the “Line Definition 1 – Blank Gray Line (1)” line at the top of the screen and change the Description at the bottom to be “Line Definition 3 - Blank Gray Line” then click OK.
- You have now made all the necessary changes so you can use the File – Save menu to save your changes and Exit the Report Designer. You will be asked if you changed the number of dimensions in the table of your report. Click the No button on that screen and you are done.