The default Raw Data reports for QC-CALC show the Out of Specification points in red, along with ** before the value. You may want to differentiate between a value being Out of Spec on the high side or the low side by showing different colors. This White Paper will give step-by-step instructions on how to show Out of Spec High values in red and Out of Spec Low values in yellow.
The Report Designer
The directions shown here will test each value for the Actual display the value in Red if it is higher than the Upper Spec Limit and in Yellow if it is lower than the Lower Spec Limit. This is a lengthy process, but relatively simple to accomplish.
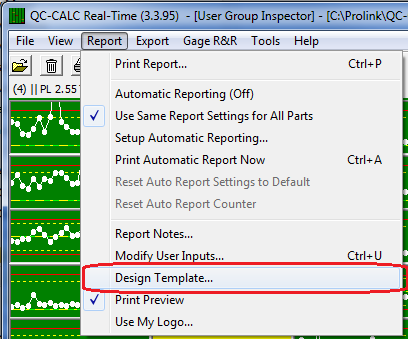
- From QC-CALC Real-Time choose the Report – Design Template menu.
- Choose the DataStat.raw template from the list of files that appears and click Open.
- The Report Designer now appears on the screen.
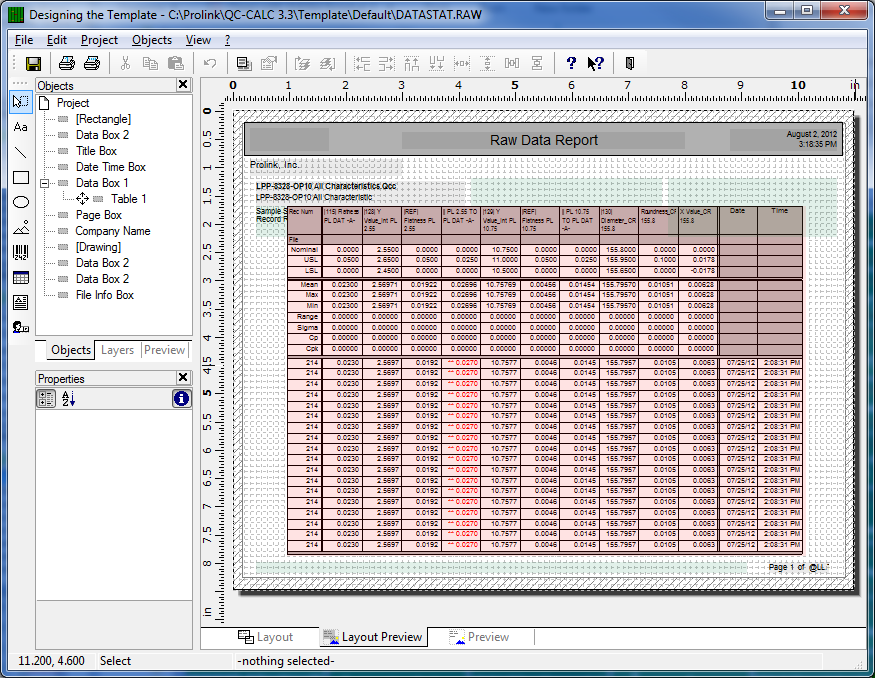
- Double-click on the table and the Table Contents window will appear.
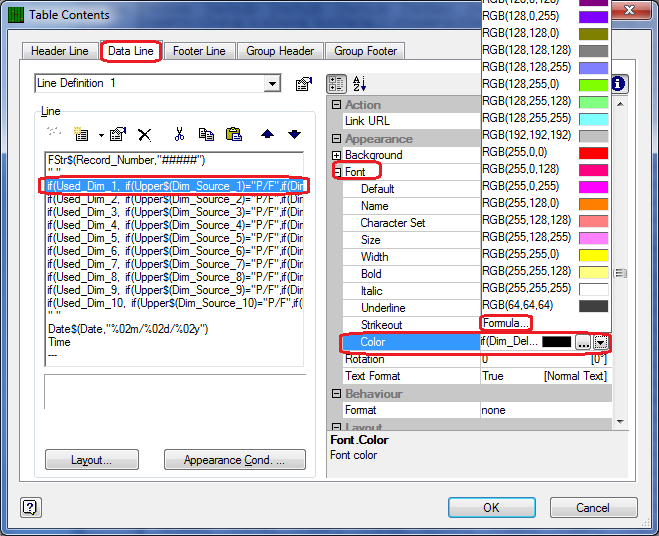
- Choose the Data Line tab and choose the “if Used_Dim_1…” line in the Line area. Now expand the Font section in the Appearance area and click in the right column on the Color line. Click on the down-arrow button on the very right side of that right column then choose Formula from the bottom of the list and the Edit Font.Color window appears. We will be working in the large box in the middle of the screen.
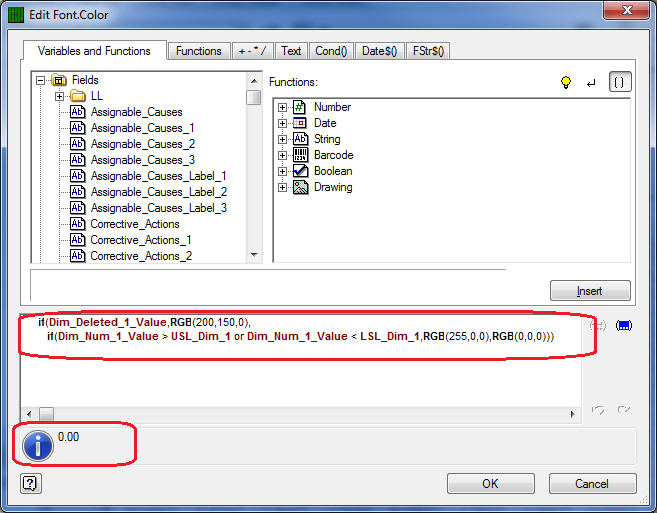
- We are going to slightly modify the formula that is already displayed here instead of starting over. The test already shown first looks to see if the cell in the table that is about to be printed has the Deleted flag set. If it does it will print the value in gold (“RGB(200,150,0)”). If the value is not deleted, then it is tested to see if it is above the Upper Spec Limit or below the Lower Spec Limit. If the value is Out of Spec then the font color is set to red (“RGB(255,0,0)”) and if it is NOT Out of Spec the font color is set to black (“RGB(0,0,0)”).
- The change that needs to be made is in the testing for the Out of Spec values. Instead of having a single test for Out of Spec in general, we need to split this into 2 separate tests. To do this we need to change the code shown in the middle of the window to:
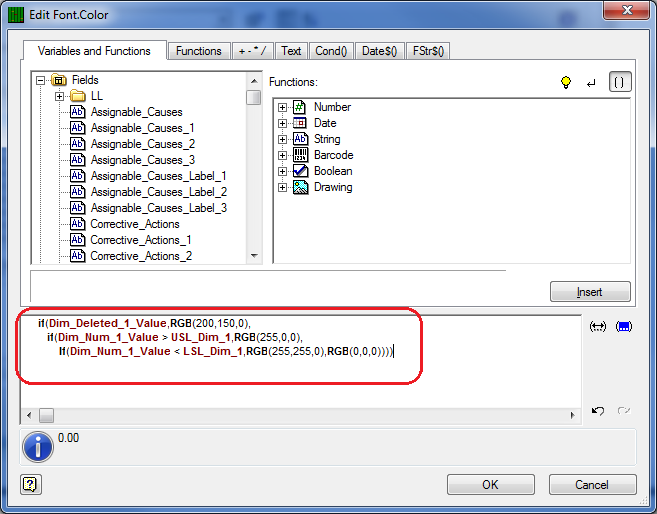
The test still looks to see if the cell in the table that is about to be printed has the Deleted flag set. If it does it will print the value in gold (“RGB(200,150,0)”). If the value is not deleted, then it is tested to see if it is above the Upper Spec Limit. If it is above the Upper Spec Limit it will print the Actual in Red (“RGB(255,0,0)”). Next it tests to see if the value is below the Lower Spec Limit. If the value is below the Lower Spec then the font color is set to yellow (“RGB(255,255,0)”) and if it is NOT Out of Spec the font color is set to black (“RGB(0,0,0)”).
- Click OK once the changes have been made and no error is reported in the lower section to the right of the “i".
- Follow steps 5 thru 8 for the remainder of the dimensions these changes should apply to. Make sure if you adjust any of the formulas to use the Dimension 2, 3, 4, … values instead of the examples that use Dimension 1. For example, the code section below from the Font Color testing has been adjusted for Dimension 6:
if(Dim_Deleted_6_Value,RGB(200,150,0),
if(Dim_Num_6_Value > USL_Dim_6,RGB(255,0,0),
If(Dim_Num_6_Value < LSL_Dim_6,RGB(255,255,0),RGB(0,0,0))))
- You have now made all the necessary changes so you can use the File – Save menu to save your changes and Exit the Report Designer. You will be asked if you changed the number of dimensions in the table of your report. Click the No button on that screen and you are done.