The Stat Summary report that comes with QC-CALC only displays columns for some statistical values, but other values can also be displayed. This White Paper will give step-by-step instructions for customizing the default template and changing the "Sigma" column to show "Percent Out of Spec" instead.
The Report Designer
The directions shown here will change the “Sigma” column to “Percent OOS” instead. This is a lengthy process, but relatively simple to accomplish.
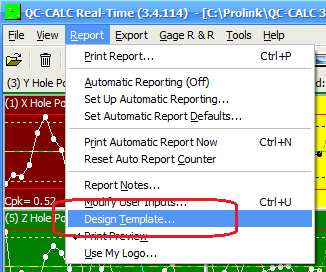
- From QC-CALC Real-Time choose the Report – Design Template menu.
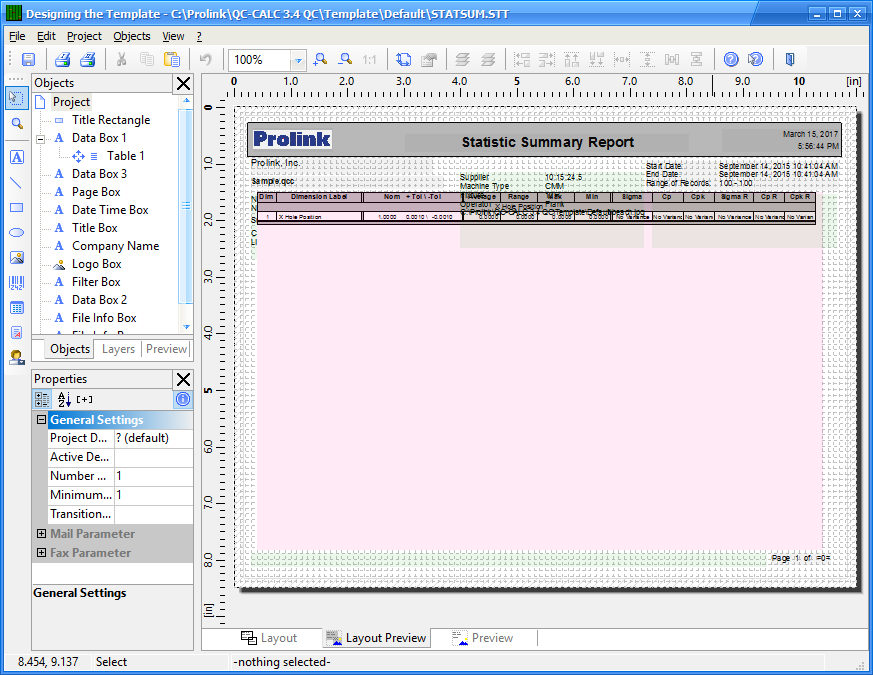
- Choose the StatSum.STT template from the list of files that appears and click Open. The Report Designer now appears on the screen.
Header Lines
- Double click on the table and the Table Contents window will appear.
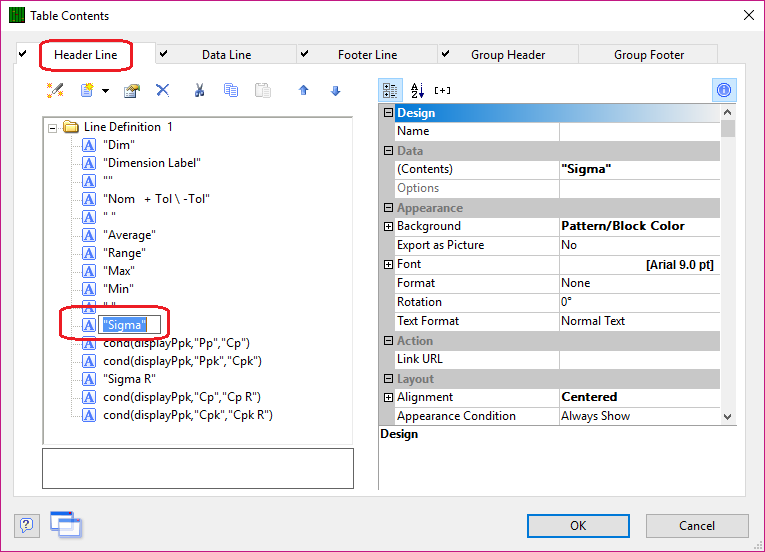
- On the Header Line tab, choose the “Sigma” line on the left and click the F2 button to edit that value. Enter “Percent OOS” as the new column heading value and click Enter.
- Now that you’ve fixed the column heading, let’s change the values that will be displayed below the heading. On the Data Line tab choose the same line you choose on the Header Line tab. It is hard to read the contents of the lines, so counting the number of lines is easier.
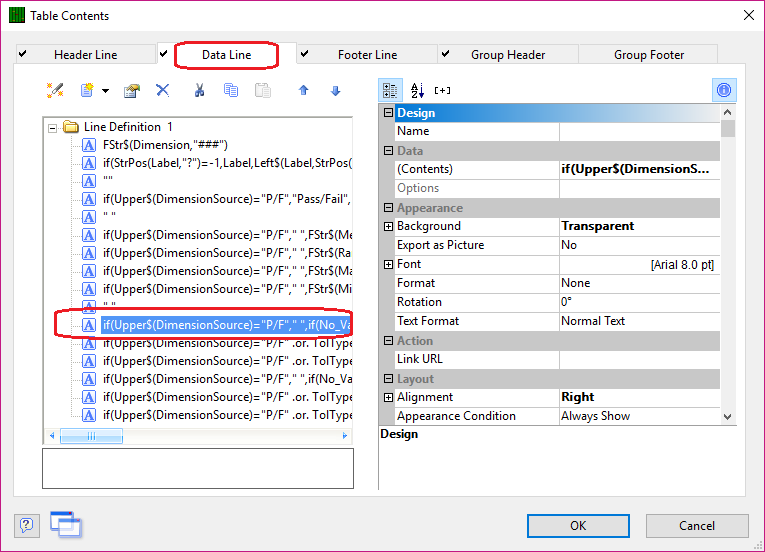
- Double-click that line and the Edit Table screen appears.
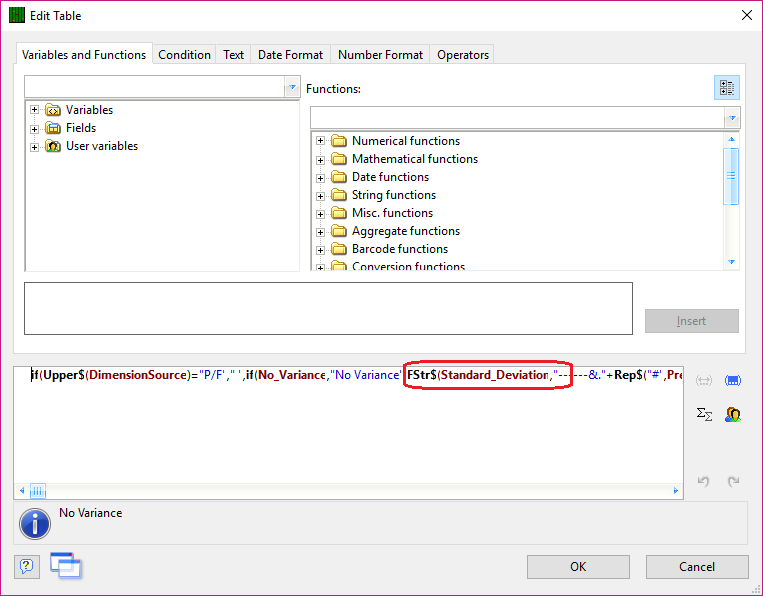
- In the Edit Table screen the line showing at the bottom of the screen has a value that needs to be changed. The “Standard_Deviation” shown in the picture below needs to change to:
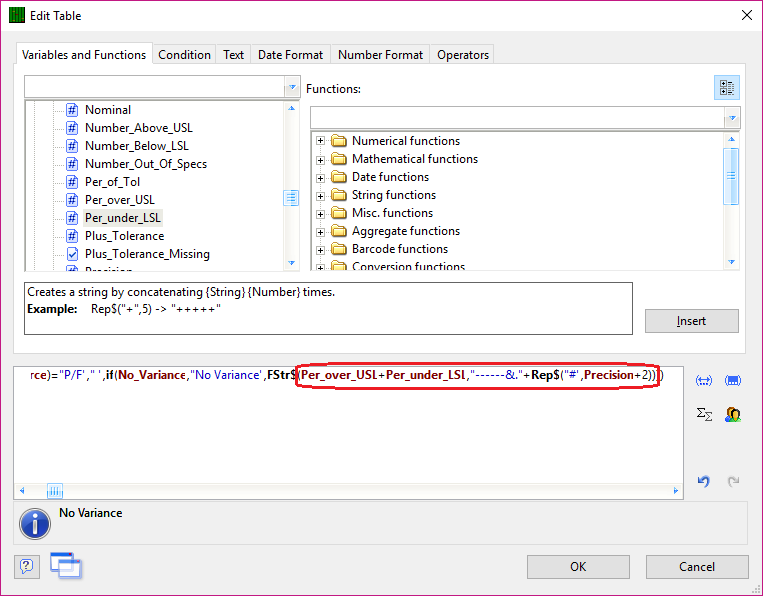
Per_over_USL+Per_under_LSL
- Now that the value being used is what you want, you need to fix the formatting (since a percentage is displayed differently than a Sigma value).
- To fix the formatting the "------&."+Rep$("#",Precision+2) section of the line needs to be changed. Enter "##&.##%" in place of the text above (make sure you remove the “)” at the end too) to allow 3 places to the left of the decimal and 2 to the right followed by a % sign.
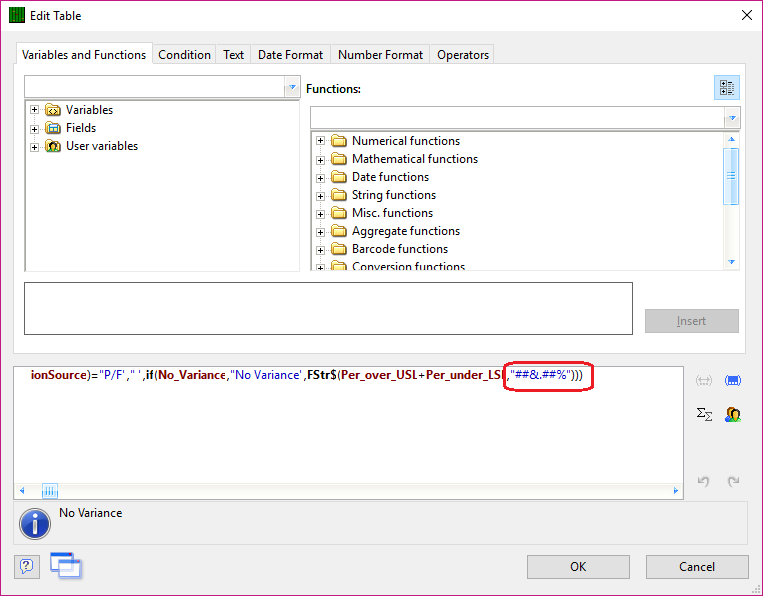
- When you’ve finished the area in the Edit Table screen that shows “No Variance” in the picture above should NOT show an error. If it does, make sure you have 3 “)” at the end of the line as that is the most common issue.
- Click the OK button on both the Edit Table and Table Contents windows and save your changes to the template.
- When you run your report you will now have a column called “Percent OOS” that shows the percentage of points that were out of spec for each dimension.