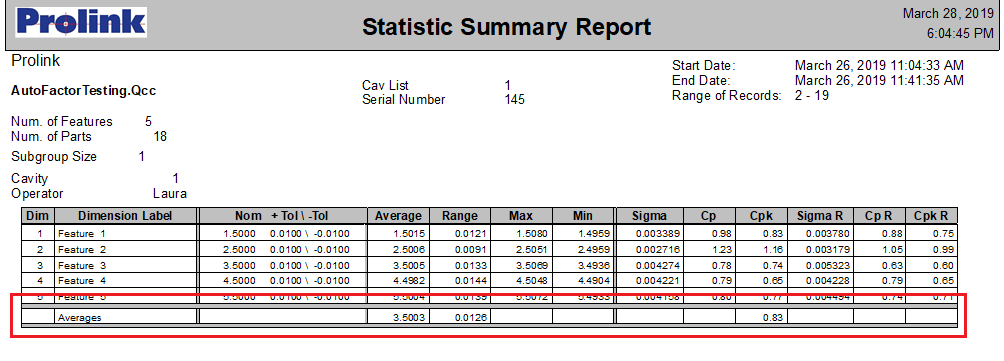
The Stat Summary template shipped with QC-CALC only displays columns for some statistical values, but you may want to calculate the average of one or more of the displayed columns. These directions will show you how to calculate and display the averages of the Average, Range, and Cpk columns.
Steps
The directions shown here will add a Footer to the report and display some averages in that footer. This is a lengthy process, but relatively simple to accomplish.
- From QC-CALC Real-Time choose the Report > Design Template menu.
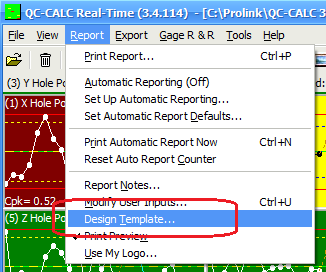
- Choose the StatSum.STT template from the list of files that appears and click Open. The Report Designer now appears on the screen.
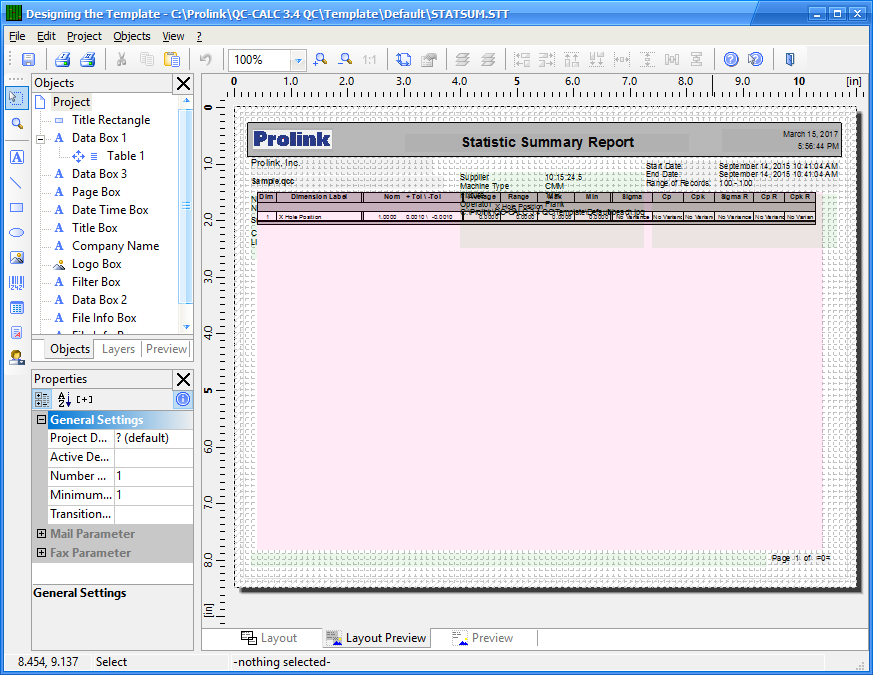
Footer Lines
- Double-click on the table and the Table Contents window will appear.
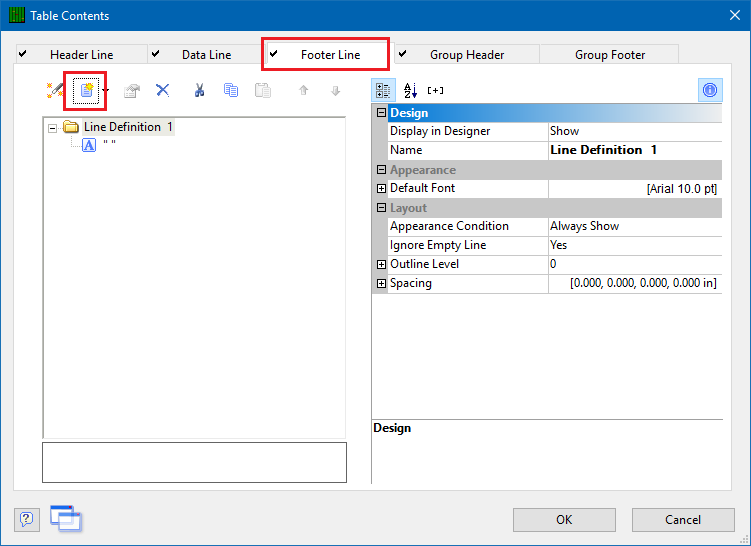
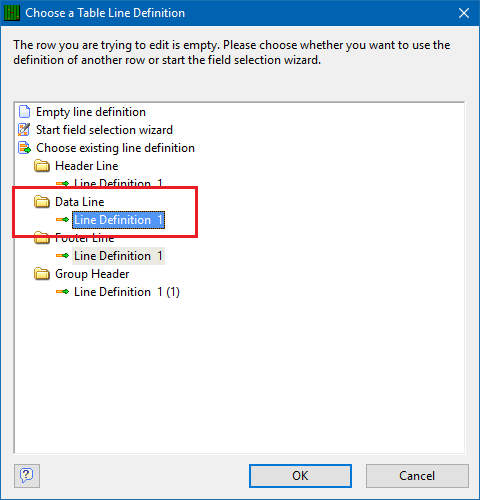
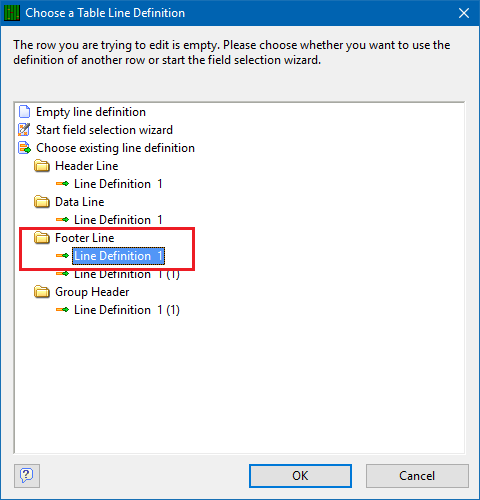
- On the Footer Line tab, choose the Append line definition button that is circled in the picture above. On the next screen that appears, choose the “Line Definition 1” item from the “Data Line” area, then click OK. This will make a copy of the Data Line and put it into the Footer area, which gives you the exact column widths to match the columns above.
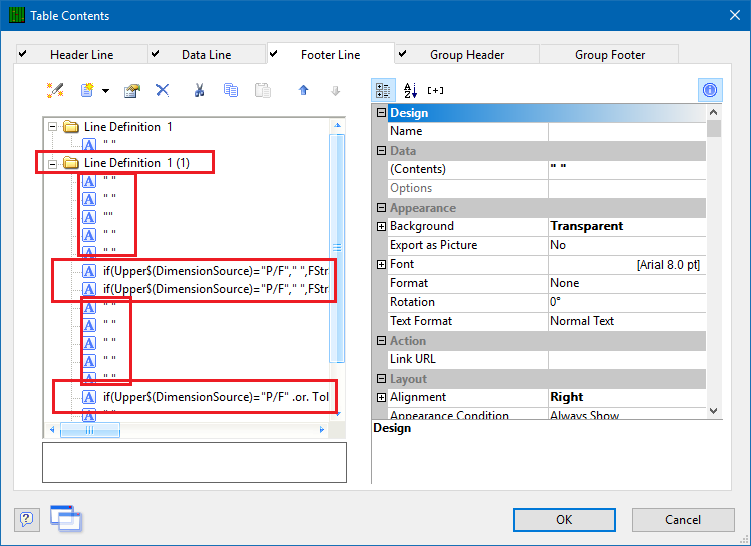
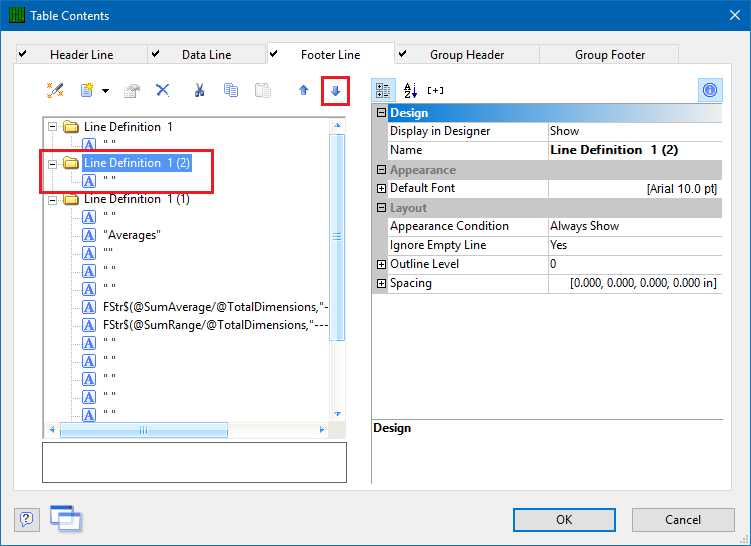
- On the Footer Line tab, you will now see 2 separate line definitons. One is a blank line and the other is the copy of the Data Line area. In the “Line Definition 1 (1)” area, double-click on each element EXCEPT the ones you wish to show the averages for, and replace the calculations shown with “ “ (quote-space-quote). The picture below shows that most items were replaced, but the “Average”, “Range”, and “Cpk” elements remain.
4. Click OK in the Table Contents window and save your changes (File > Save).
@Sum Variables
- The next thing that is needed is to create the @Sum variables that will be used to add together all of the items for each column. Go to the Project > Sum Variables menu and click the Insert a new variable button in the upper right corner.
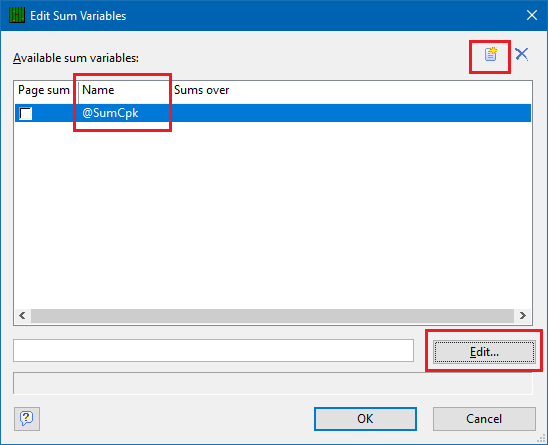
- In the Create New Variable window that appears, enter a name that describes the contents of this variable. In this example, the Cpk column will be added up, so the “SumCpk” name is used.
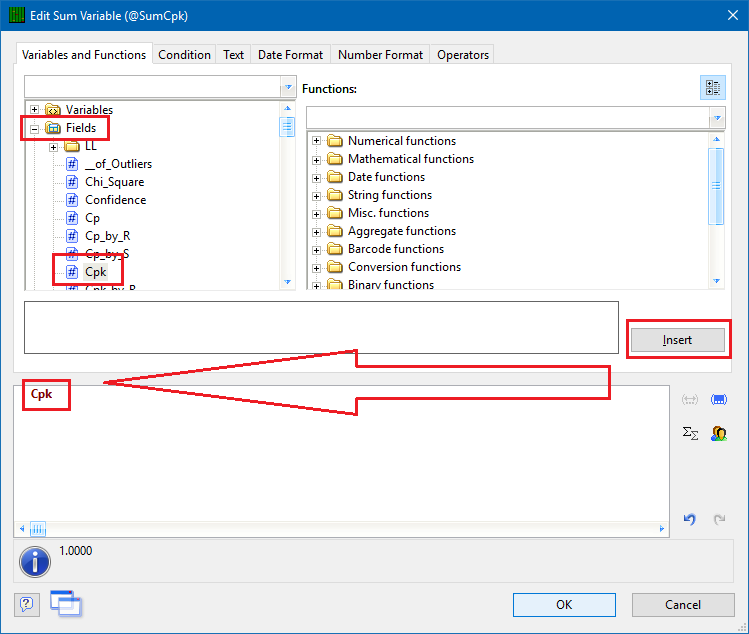
- Next, click the Edit button so the calculation can be entered. In the Edit Sum Variable (@SumCpk) window that appears, choose “Cpk” from the “Fields” area in the Variables and Functions tab, then click the Insert button so it appears in the box at the bottom of the screen.
- Click OK to return to the Edit Sum Variables screen and follow steps 5 – 7 to create the “SumRange” (use the “Range” Field) and “SumAverage” (use the “Mean” Field) variables.
- The last thing to do in this area is to create another @Sum variable that will count the total number of rows (dimensions) in the report. This will be divided into the other @Sum variables in order to get the Average of the Averages, Ranges, and Cpks.
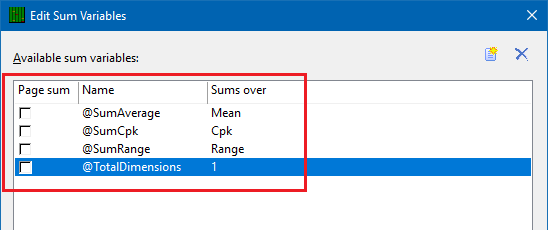
- Click the the Insert a new variable button and enter “TotalDimensions” as the name.
- Click the Edit button and enter a 1 in the bottom box (where the “Cpk” has the arrow pointing at it in the picture above).
- When all variables are added (see the picture below), click OK and save the changes to the template.
Footer Lines
- Now that the variables that contain the sum of the columns exist, those values need to be displayed in the Footer area of the table.
- Double-click on the table to bring up the Table Contents window again.
- Go to the Footer Line tab and double-click on the item that corresponds to the Average column. That value should look like this (before any changes):
if(Upper$(DimensionSource)="P/F"," ",FStr$(Mean,"---&."+Rep$("#",Precision)))
- Delete anything that is shown in red above (don’t forget the end parenthesis too) so you are left with:
FStr$(Mean,"---&."+Rep$("#",Precision))
- Most of this line will remain as it is, but the “Mean” value is going to be changed to “@SumAverage/@TotalDimensions”. Ignore the “ERROR” being reported at the bottom of the screen. The fact that the report wasn’t actually processed is causing invalid values in the @Sum variables. This will work correctly when you run the report though. This should be the line when you’re done:
FStr$(@SumAverage/@TotalDimensions,"---&."+Rep$("#",Precision))
- Do the same basic step for the Range and Cpk lines. The lines should end up like this:
FStr$(@SumRange/@TotalDimensions,"---&."+Rep$("#",Precision))
FStr$(@SumCpk/@TotalDimensions,"--&.##")
- Double-click on the 2nd item in the Line Definition we have been dealing with (this corresponds to the “Dimension Label” column) and change the “ “ to “Averages” or whatever you would like to use to describe the values displayed in this footer.
- There is one last thing to do: On the Footer Line tab, choose the Append line definition button again. On the next screen that appears, choose the “Line Definition 1” item from the “Footer Line” area, then click OK.
- This will make a copy of the blank gray line that is already in the footer area, but both lines will currently appear before the Average line. To fix that, click on the “Line Definition 1 (2)” line that was just created, then click the down arrow button right below the Footer Line tab.
- Click the OK button on Table Contents window and save your changes to the template.
- When you run your report, you will now a new footer row that shows the average values that you wanted.