Live Dashboard Display
QC-CALC SPC Pro includes a live dashboard display where you can create and customize dashboards to fit your company's needs. Create as many dashboards as you need and run them all live in parallel either in the application or as a Windows service. Interactive drill down display of the dashboards is available in QC-Mobile.
Drag and Drop Widgets
Dashboards are created with a set number of rows and columns. Customizable
widgets are then dragged into place, configured with a data source and look, and then set to refresh at an interval such as every 1 minute. Colors, styling, and the type widgets is completely customizable. Widgets can also be mixed and matched on the same dashboard.
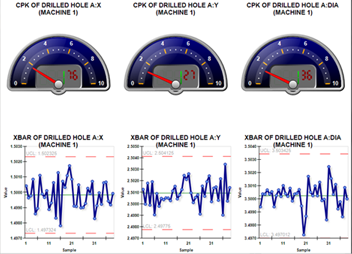
Add histograms, trend charts, XBar & R, pie charts, comparison bar charts, text areas, images, and various gauges. It's all a few clicks away!
Visual Factory Options
Dashboards can be saved as image files whenever they refresh allowing them to be posted visual factory overhead displays or other marquees using QC-Mobile, an internal website, or inserted into business presentations and customer reports.
Monitor the Shop Floor
Dashboards can be used to monitor the shopfloor or a particular line by placing control charts side by side. Machines and lines can easily be compared and long term Cpk/Ppk trends displayed.