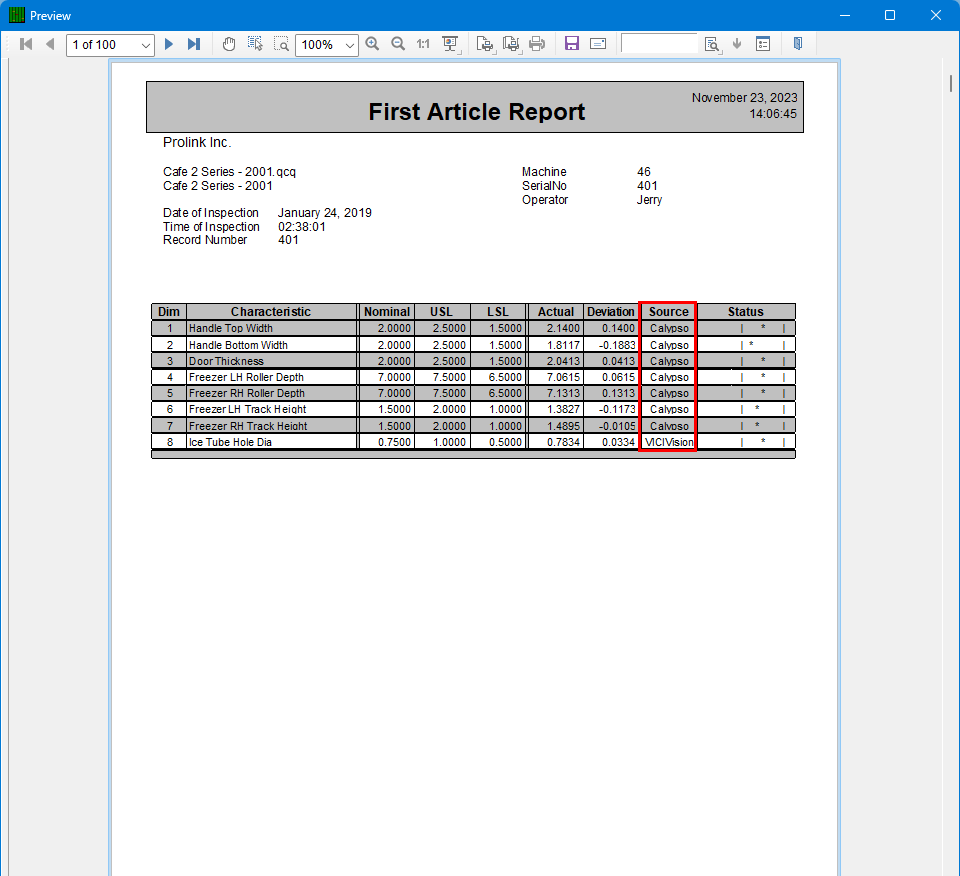
The default First Article templates shipped with QC-CALC do not display the Characteristic Source value. This White Paper will give step-by-step instructions for adding a Characteristic Source column to the standard First Article template.
Steps
The directions shown here will walk you through adding a column for Characteristic Source in the report and shrinking the remaining columns to make enough room on the page for an additional column. This is a lengthy process, but relatively simple to accomplish.
- From QC-CALC Real-Time choose the Report > Design Template menu.
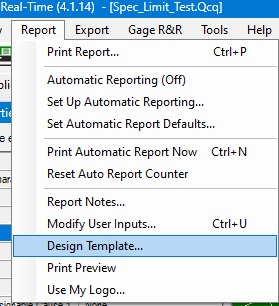
- Choose the OnePiece.FST template from the list of files that appears and click Open.
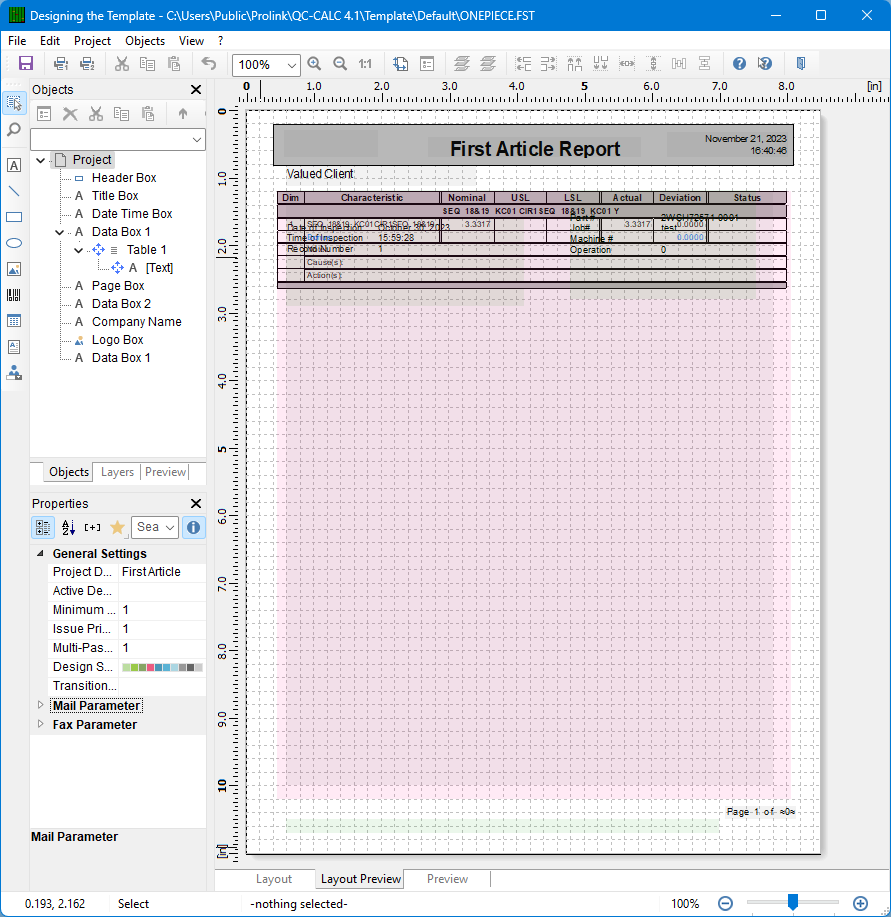
- The Report Designer now appears on the screen.
Making more Space
- Double click on the table (the large pink rectangle) and the Table Contents window will appear.
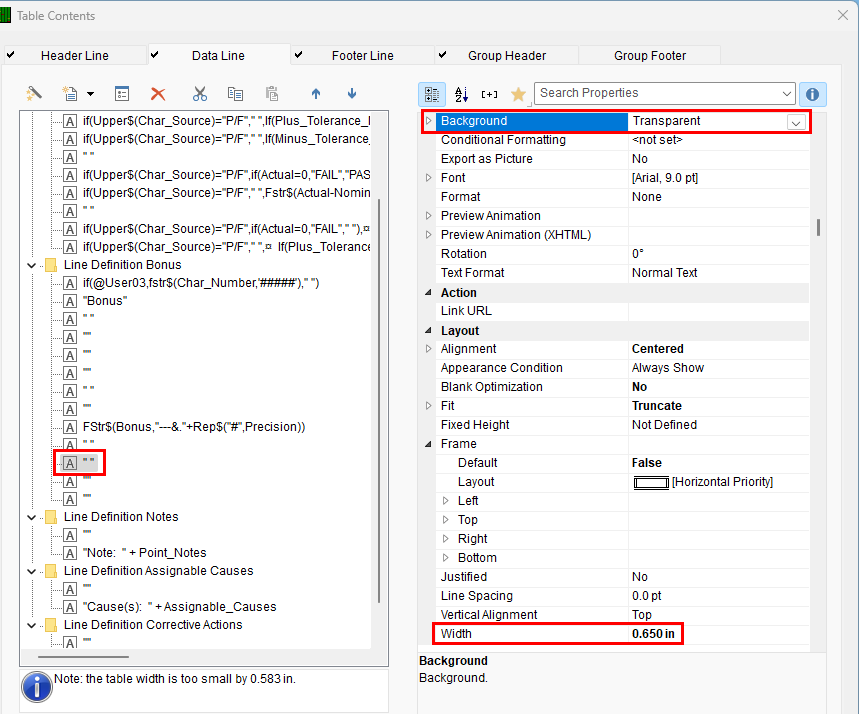
- Choose the Data Line tab then use the CTRL key to click and highlight the lines for the specification values and the Actual and Deviation values in the Line Definition 1 area and set the Width under Layout for all 5 lines to “0.65.” Be sure to skip the blank line in the middle.
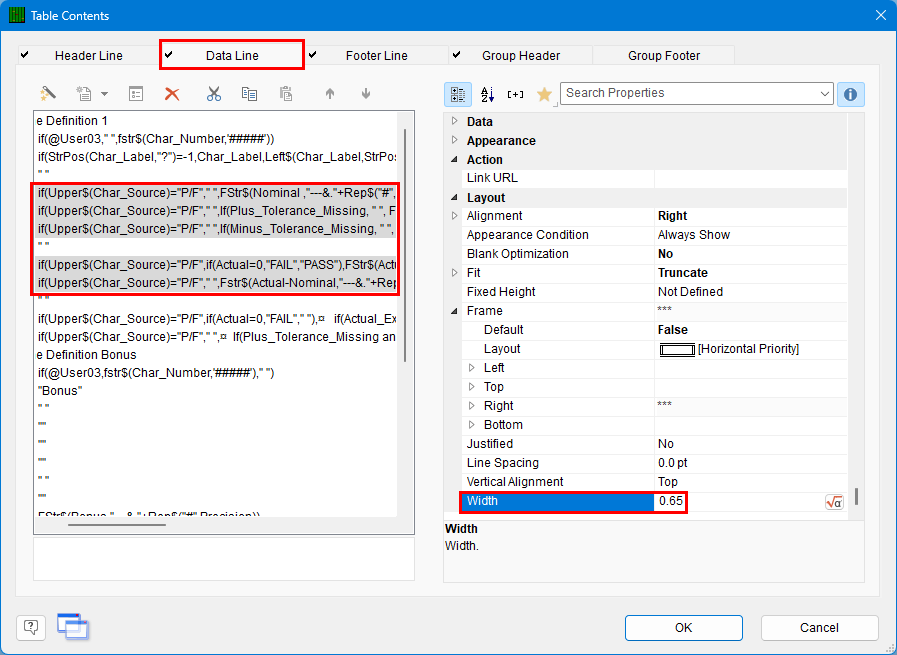
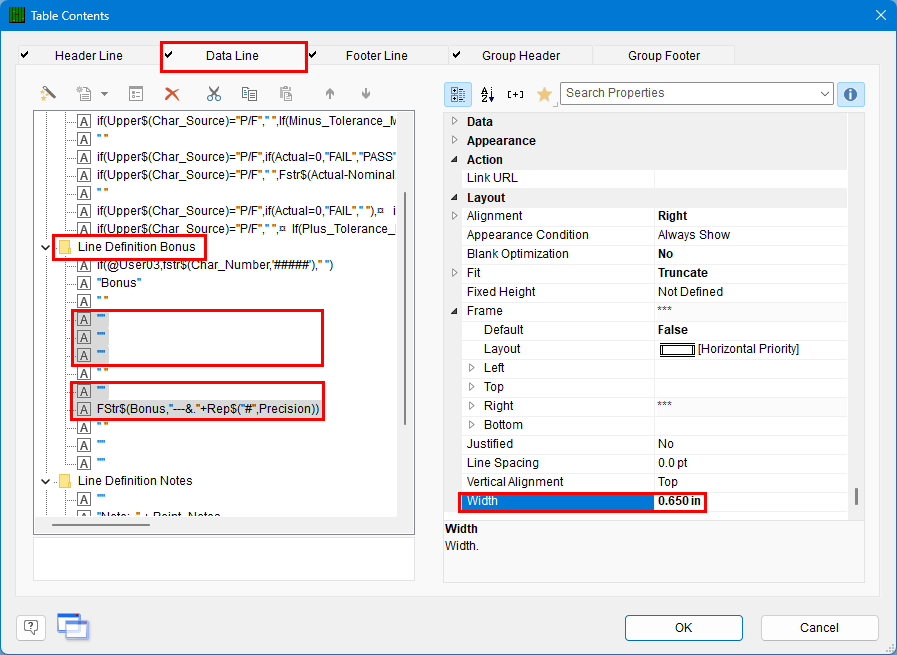
- Scroll down into the Line Definition Bonus area. Use the CTRL key to highlight the matching lines from the previous step and set the Width under Layout for all 5 lines to “0.65.” These are mostly blank, so match the pattern below.
- Now that we have made room in the Data area for the additional column, we need to do the same thing in the Header area.
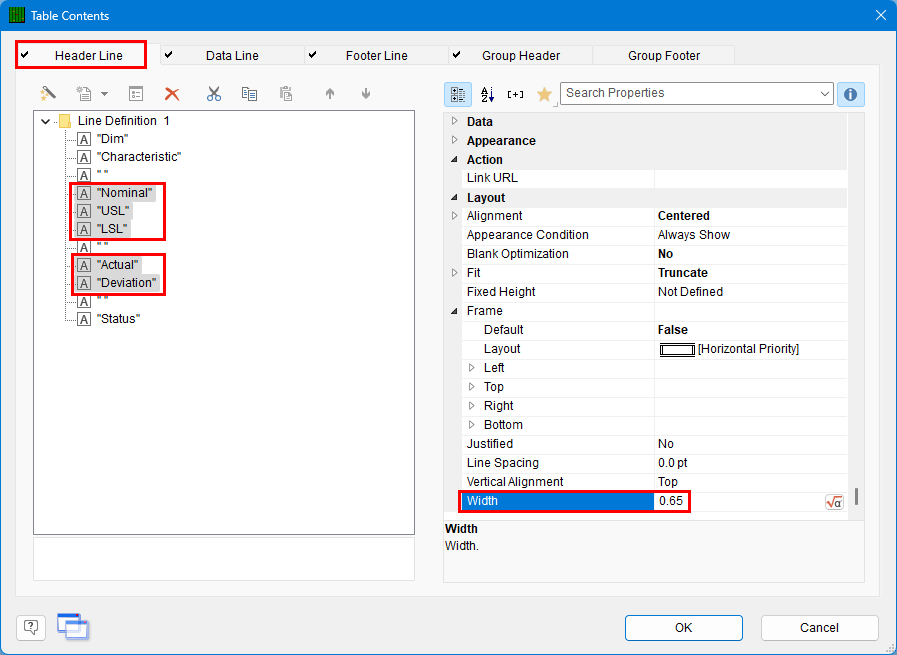
- Choose the Header Line tab then hold the CTRL key and click to highlight the specification titles and the Actual and Deviation lines in the Line Definition 1 area and set the Width under Layout for all 5 lines to “0.65.” Be sure to skip the blank line in the middle.
- Click the OK button then choose File - Save, to save these changes.
Adding a Column
- Double click on the table and the Table Contents window will appear again.
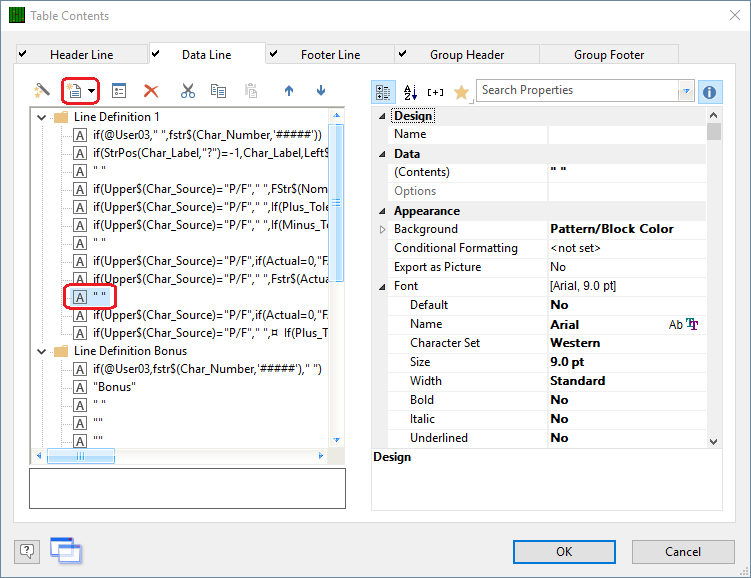
- Choose the Data Line tab, highlight the 3rd to last line in the Line Definition 1 area, then click the Append column button.
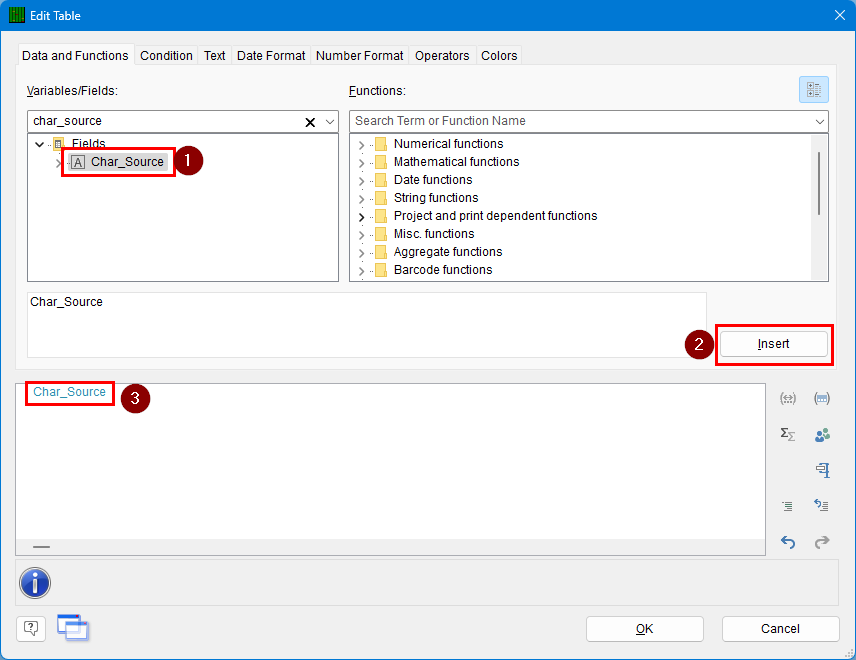
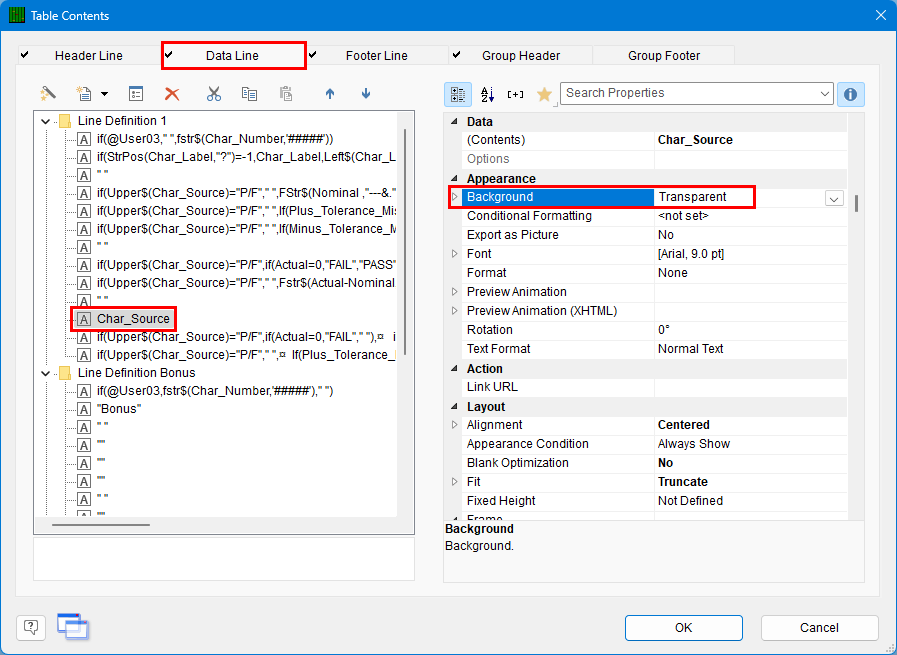
- In the Edit Table window that appears, choose “Char_Source” in the Fields list, then click the Insert button.
- Click OK on the Edit Table window, then, with the “Char_Source” line highlighted on the left, change the Width to “0.650” and the Background to “Transparent.”
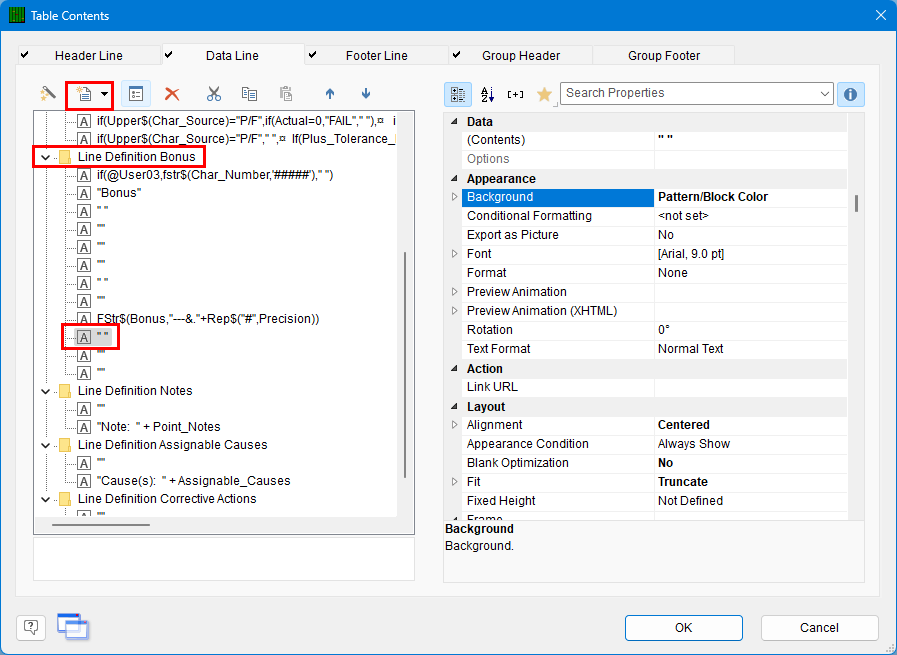
- Next, the same changes need to be made to the Bonus line. Highlight the 3rd to last line in the Line Definition Bonus area and click the Append column button.
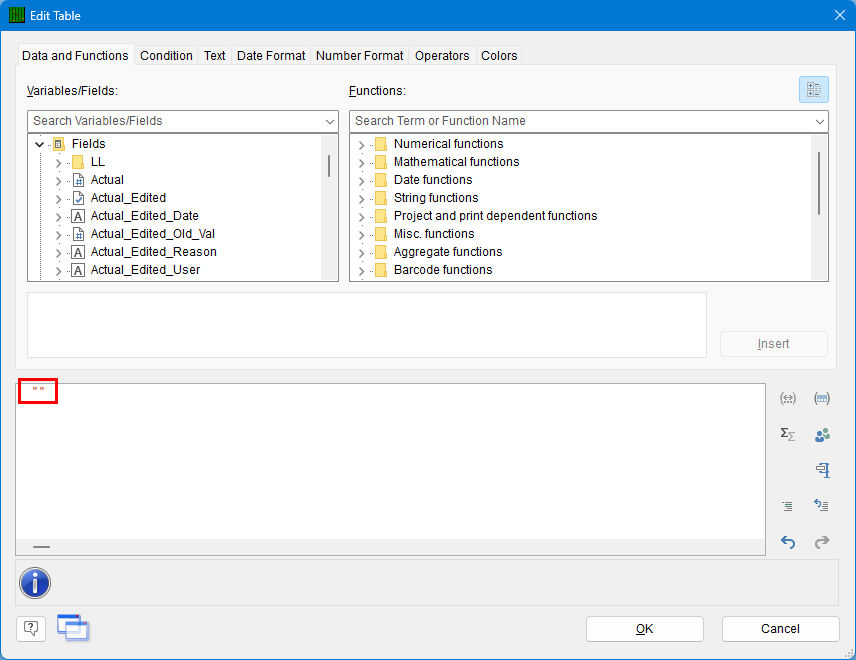
- In the Edit Table window that appears, enter “ ” (two quotation marks with a space between them) in the box at the bottom.
- Click OK on the Edit Table window, then in the Table Contents window highlight the “ ” line on the left, navigate to Layout on the right and change the Width to “0.650”, then scroll to Appearance and change the Background to “Transparent.”
New Column Header
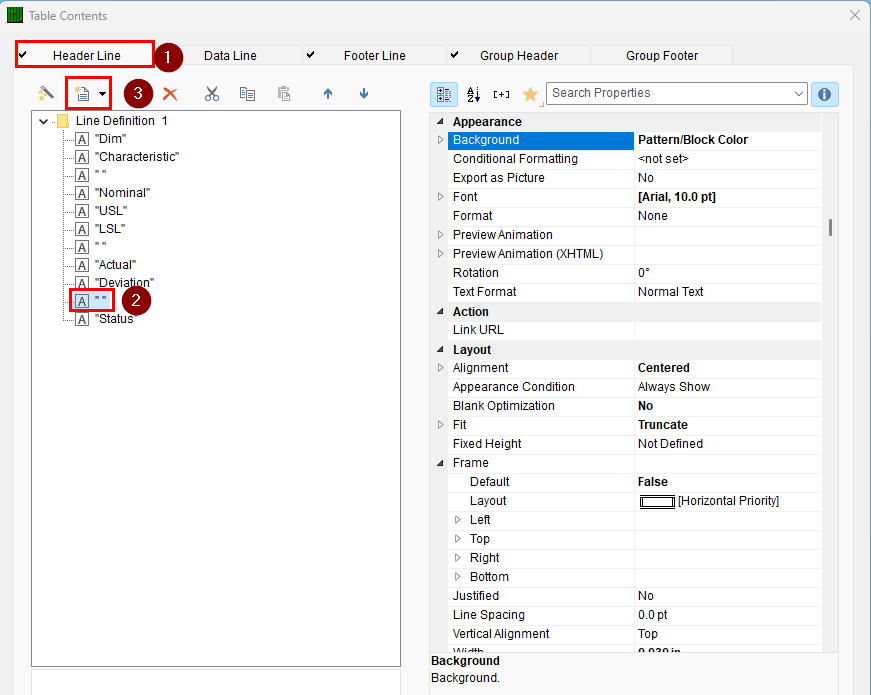
- In the Table Contents window choose the Header Line tab.
- Highlight the “ ” line after “Deviation”, then click the Append column button.
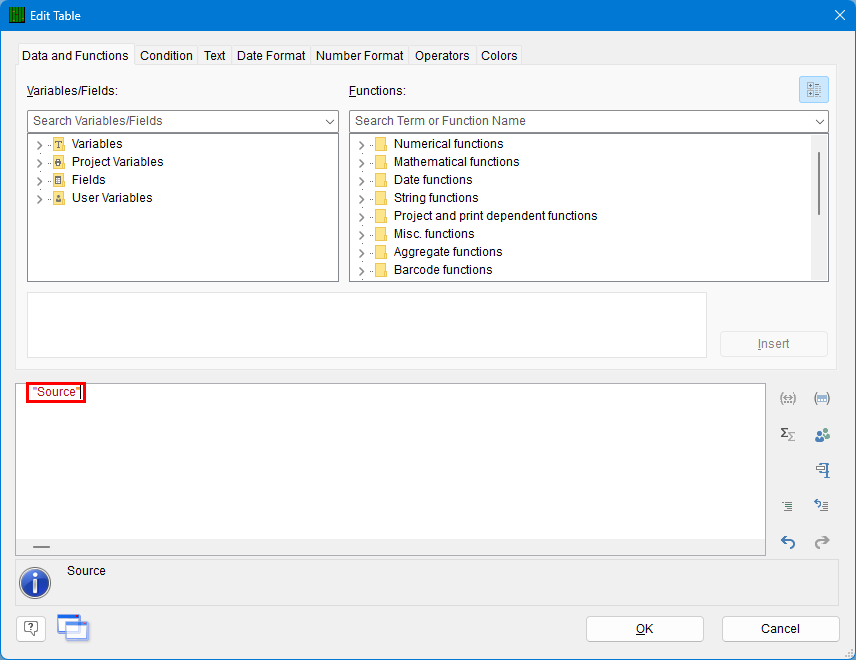
- In the Edit Table window that appears, enter “Source” (including quotation marks) in the bottom box and click OK.
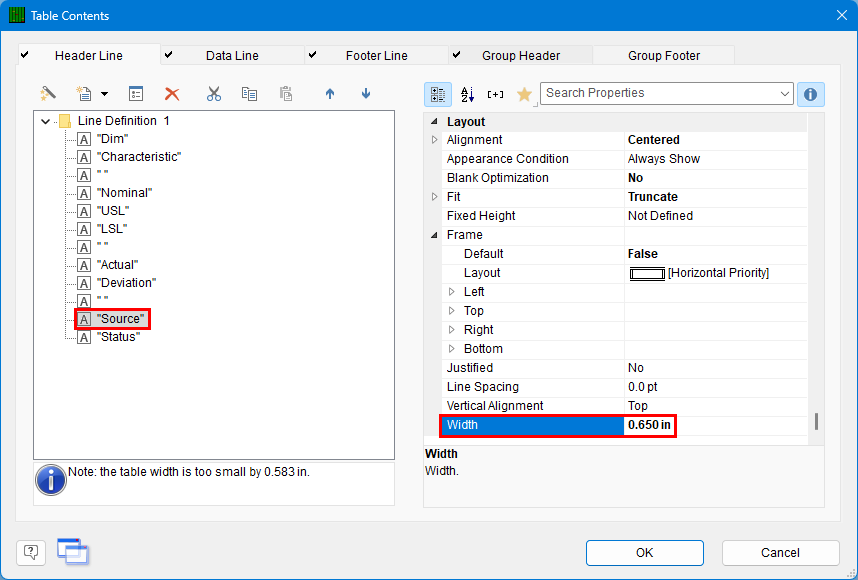
- Back in the Table Contents window, highlight the “Source” line on the left and change the Width to “0.650”.
Final Steps
- Click OK on the Table Contents screen and save your changes (File > Save).
- Exit from the Report Designer and run your report.
- You should see the contents of the Characteristic Source field appearing in your report now.