The idea is usually that the customer makes a small amount of each part because they produce parts in short runs. This makes SPC hard because there are not enough samples to get accurate Cpks. As an example, they produce only 20 parts of 5 different part types. Each feature doesn't really have enough data to get accurate statistics, but when all are combined, there are 100 parts which is plenty of data to get statistics. In this case, the tolerances must be the same, but the nominals can be different. As such, we set the tolerances normally and then plot the different characteristics as one characteristic sorted by measure date and plot the deviations rather than actual values.
Consider this example:
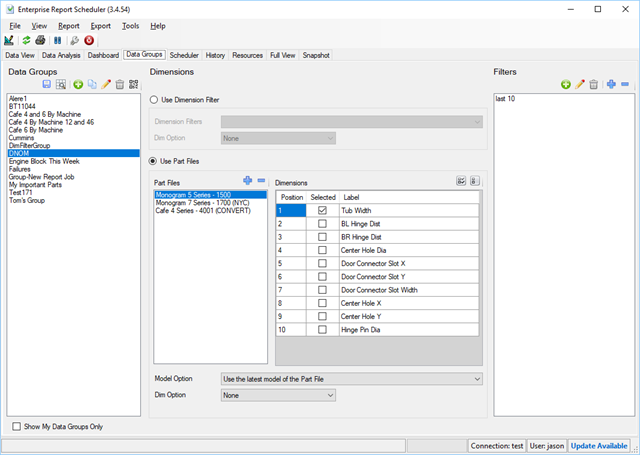
A data group was created with three part files; "Monogram 5 Series", "Monogram 7 Series", and "Cafe 4 Series". One characteristic was chosen from each part file. All three characteristics that were chosen have the same tolerances, but their nominals are very different. One has a nominal of 36.5 and another has 2.6 in this example. A filter called "Last 10" was then added which will pull only the last 10 records from each file.
When the Short Run chart is run in ERS, it produces the following:
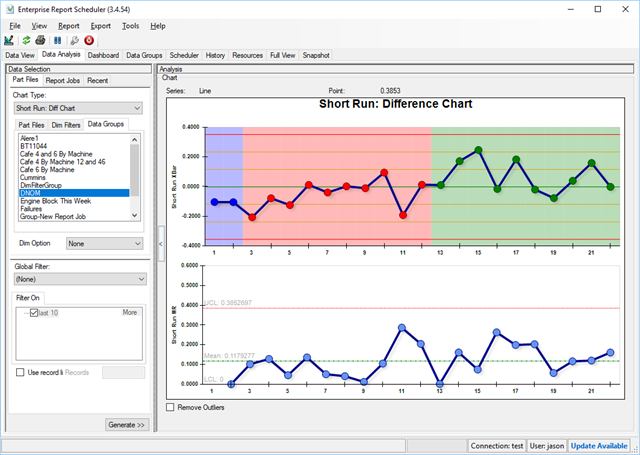
In this case, there were only 2 records in the Monogram 5 file so it just plotted them rather than the last 10. ERS automatically colorizes the dots from the different characteristics. Since there are a total of 3, we automatically colored the blue, red, and green.
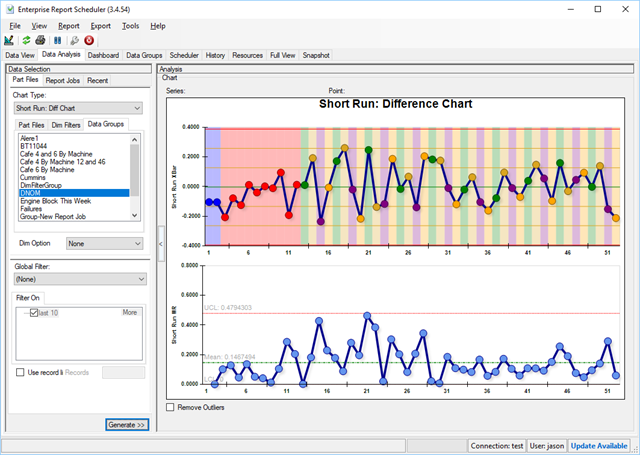
More characteristics were added to the Data Group and the chart below was run. Since the characteristics were all measured at the same time (from the same part file), it produced a striped affect when sorting by measure date. An option to only change colors when the part file changes is being discussed, but has not been added as of yet.
An example of the report that is generated for this chart type is shown below.
PDF File Link