Description
This article describes the Prolink Speed Test application and the process that allows the results to be distilled into percentiles for comparison. The application's main goal is to address customer complaints of “slowness” within Prolink’s software products. Since “slow” is a subjective term, we need to quantify exactly how fast things are running on a customer’s network server and/or SQL Server to determine if the issue is with the customer or our software.
Prolink Speed Test
Prolink Speed Test is a simple application that does a few standard tests to compare the tests to those of other customers. As of QC-CALC 4.0.63, Speed Test is already installed on the PC along with our software and is accessible via the Help menu. The idea is to run the tests and compare them vs. other customers. There are three tabs on the screen. The first tab is the testing screen.
Speed Test
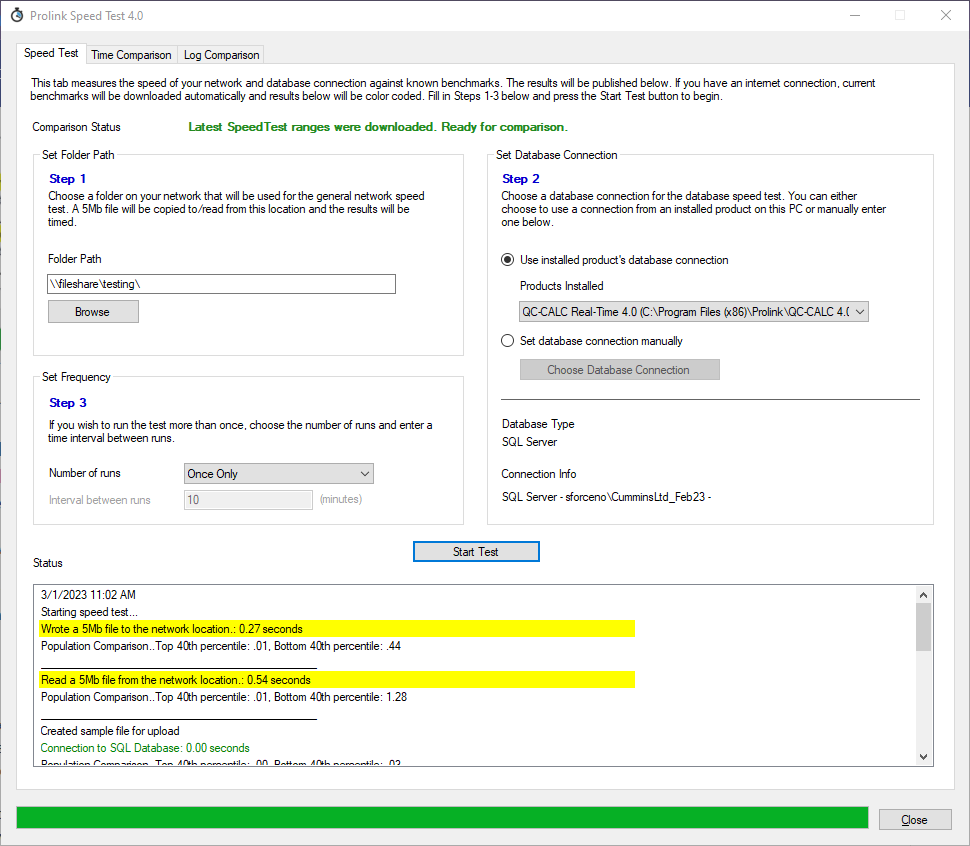
The Speed Test screen is where the testing is performed. When launched, the application attempts to download the latest benchmark ranges from the Prolink website. If successful, a green label will be displayed saying, “Latest SpeedTest ranges were downloaded. Ready for comparison”. If the download from the website is not successful, the application will still look into the folder to see if an existing range file exists. If it does, a yellow message will appear stating, “Download failed, but SpeedTest ranges were found. Using available ranges.” If no file is found, a red message will appear stating, “No SpeedTest ranges found. Comparison disabled.” In all cases, the speed test can still be performed. However, comparison colors in the results list and Population Comparison lines will only appear if a range file is present.
To run the test, the customer should provide a folder path on the network (or mapped drive) where s/he has read/write access. If running QC-CALC, the admin path would be a good example.
After entering a path, enter a database connection. The application automatically detects other Prolink software installed on the same PC and adds the database connection paths to a list. Choosing one from the list will automatically use the same connection as the application chosen. Alternatively, you can manually specify a connection to a QCQ path or SQL Server database.
At the bottom, you can then optionally choose to run the test once or multiple times with an interval (minutes) between runs. For instance, it is possible to run it 10 times with a 6-minute interval, which means it will run for an hour.
When ready, click Start Test to start the run. The tests will be performed and timed, and the results will begin to appear in the window. If a range file is found, the results will be colorized according to where they fall compared to other customers. Results in the top 40th percentile of other users are colored green, results between the top 60th and top 40th percentile are colored yellow, and values in the bottom 40th percentile are colored red.
When a test is run, the results are saved to the main repository path (c:\ProgramData\Prolink\Prolink Speed Test 4.0\) as speedtest[yyyyMMddhhmmss].log files. Each test gets its own time-stamped log file. These log files have all the database metrics, as well as the workstation name, time of the test, and test results.
The following tests are run and timed:
- File Write - A 5Mb file is copied to the network location.
- File Read - The same 5Mb file is copied from the network to the local path.
- Database Metrics (SQL Server only) - The database metrics are gathered (file count, record count, etc).
- Database Connection - The connection to the database itself is tested. For SQL Server, this happens immediately after the file is copied. For QCQ this happens after the creation of QCQ.
- Part File Conversion - Sample100.qcq is converted into the database path as a [GUID].speedtest. If QCQ, it will have a .qcq file extension. This file is a slightly modified Sample100 in that it has 5 trace fields (2 numeric and 3 text). Otherwise, it is the normal Sample100, containing 100 characteristics and 100 records.
- Lastx Query - The last 50 records are queried from the database to mimic a typical QC-CALC RT screen’s worth of data.
- Part File Deletion - The part file is deleted from the database in the case of SQL. QCQ file is deleted in the case of QCQ.
Comparisons against percentiles are based on database type (QCQ vs. SQL) and database size, which are arbitrary size ranges. As of this writing, the following sizes are assigned based on the number of records in the part table.
Size | Number of records in Part table |
Small | <= 50,000 |
Medium | 50,001 - 250,000 |
Large | 250,001 - 500,000 |
Extra Large | >500,000 |
Time Comparison
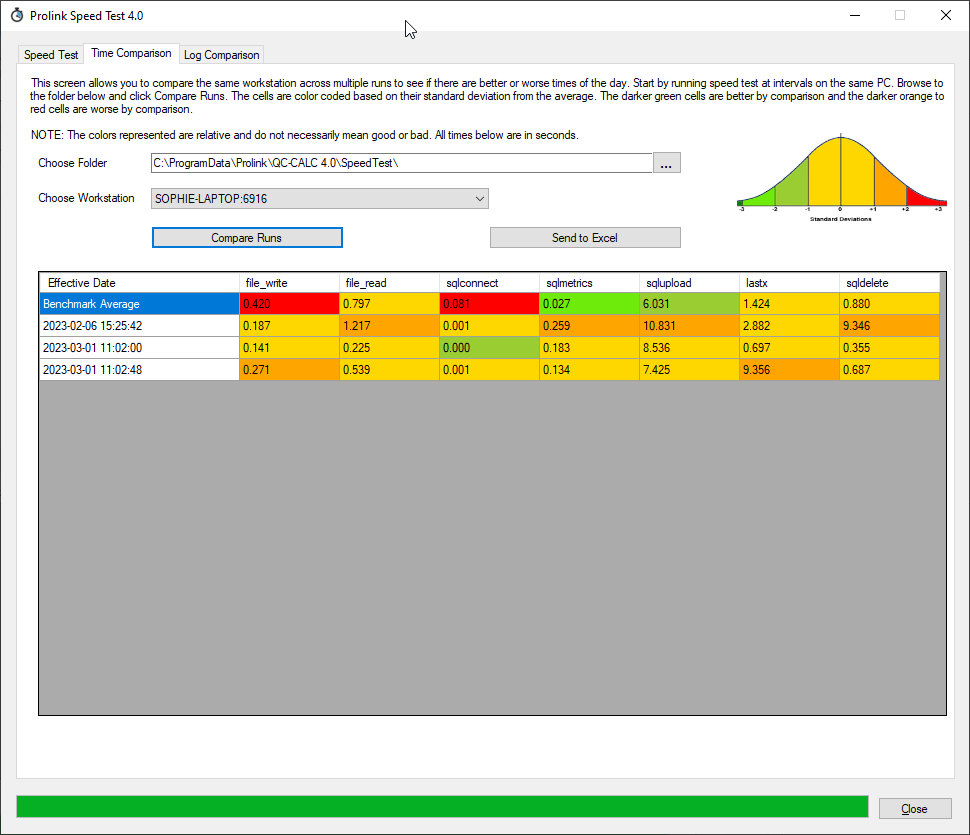
The Time Comparison screen lets you compare multiple speed tests on the same PC. This is especially handy if you run the interval test with multiple runs. The screen automatically points to its local repository path (c:\ProgramData\Prolink\Prolink Speed Test 4.0) but can be redirected to a different folder if desired. When a new folder is chosen, a unique list of workstations is found and loaded into the list. Choose the workstation from the list and select Compare Runs.
The runs will be loaded by date/time and displayed in the grid. To colorize, the list of results for each test are averaged and a standard deviation is calculated. Each result is then compared against the standard deviation to place it somewhere in the bell curve. Values within 1 standard deviation of the average are gold. As the numbers increase, they become closer to red in the spectrum since the results are relatively slower. Likewise, lower numbers are relatively faster and trend toward green.
It is important to understand that the colors are not a judgment of good or bad despite the green and red coloring since they are relative to the other runnings on the same PC. However, it can identify times of the day when the workstation runs slower due to network and/or database traffic, etc. The benchmark average is also added to the first row as a comparison. If the benchmark average is red, it means the current average is above (faster than) the benchmark of other customers. Likewise, if the benchmark is green, the current average is below (slower than) than other customers.
The results can be saved to Excel (assuming they are present on a PC) for later comparison.
Log Comparison
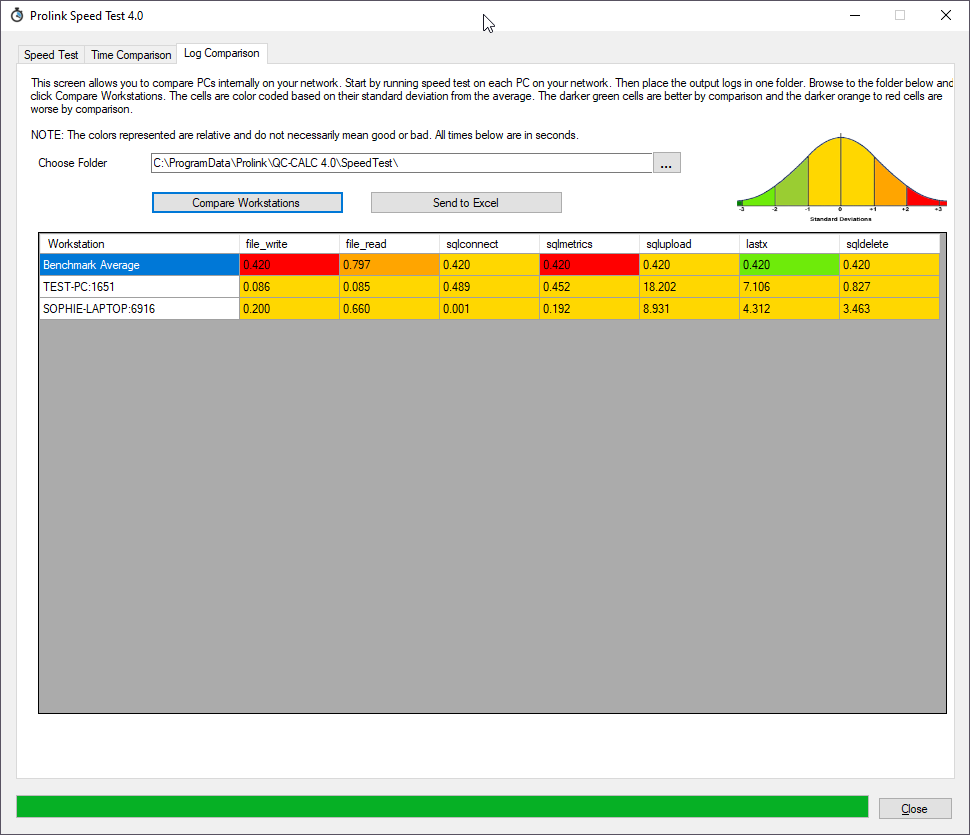
The Log Comparison screen allows you to compare logs from different PCs. This can be handy if one workstation is on an older network link and is experiencing slower performance than others. The same math applies as the Time Comparison with the average and standard deviation of each test and the colorizing of the grid cells based on their distance from the average. Again, this is not necessarily measuring good or bad. The goal is to compare relative scoring of various workstations on the network. For instance, if the average 5Mb upload speed is .03 seconds and one of the PCs is 1 second, it will be colored red but it still a very fast upload speed overall.
If multiple tests from the same workstation are found in the folder, they are averaged together before being compared to the other workstations.
This screen is most often used by an Implementation Specialist during a customer implementation. The test would be run on each PC, and the results would be copied to a memory stick or central network folder. The folder path on this screen can then be pointed to the memory stick, and the results would be compared to look for outlier workstations.
The results can be saved to Excel (assuming they are present on a PC) for later comparison.