Introduction
This article discusses creating a True Position plot in QC-CALC Real-Time 3.3, but the directions are identical to version 4.1. To construct this plot, you will need to know your X, Y, Diameter, and True position (pin or hole) dimensions/characteristics.
Steps
- Choose the View > Configure True Position... menu.
- In the True Position Editor screen:
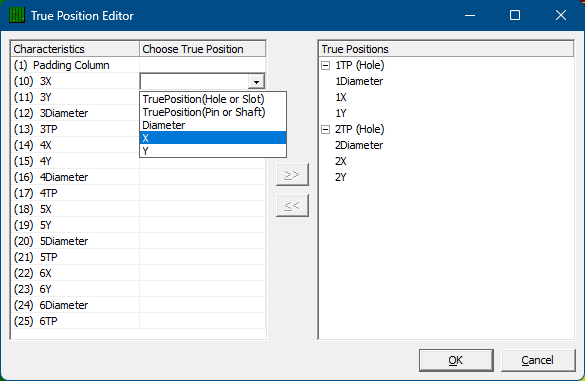
- Find the first dimension/characteristic that will make up the true position plot in the list on the left.
- Choose the appropriate X, Y, Diameter, TP option from the list.
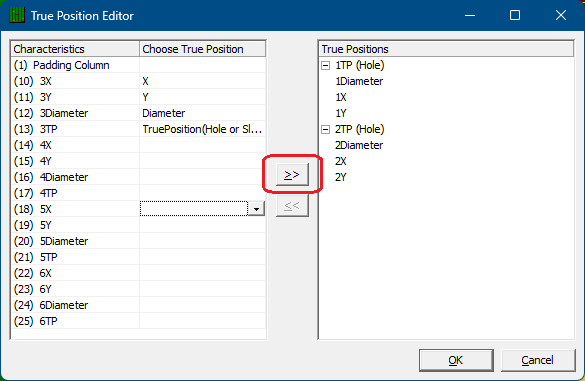
- Repeat this for all dimensions/characteristics needed to create the True Position plot.
- When all dimensions/characteristics have been assigned the correct option, click the >> button (Add >> in earlier versions of QC-CALC Real-Time). If the Add button is grayed out, click a dimension/characteristic other than one of those selected, and it should enable itself.
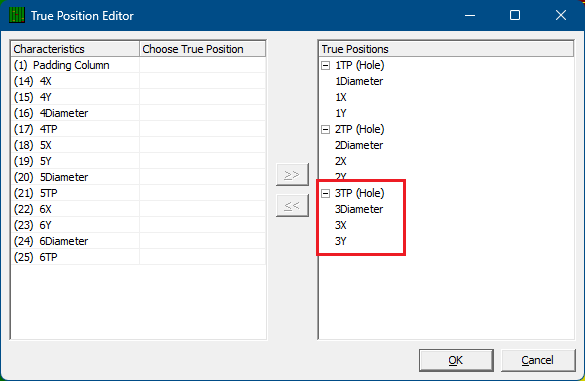
- Once the grouping has been added, it will appear on the right side of the screen. Click OK to accept the groups. The new True Position Plot should appear.
More Information
To Remove a True Position, select the grouping on the right side of the screen and click the << button (Remove << in older versions of QC-CALC Real-Time). After clicking OK, the True Position plot should no longer appear.