This article describes how to customize the plots so the colors are exactly what you want to use.
Steps
- In QC-CALC Real-Time go to Tools > Options > Configure Plot Settings > Plot Colors.
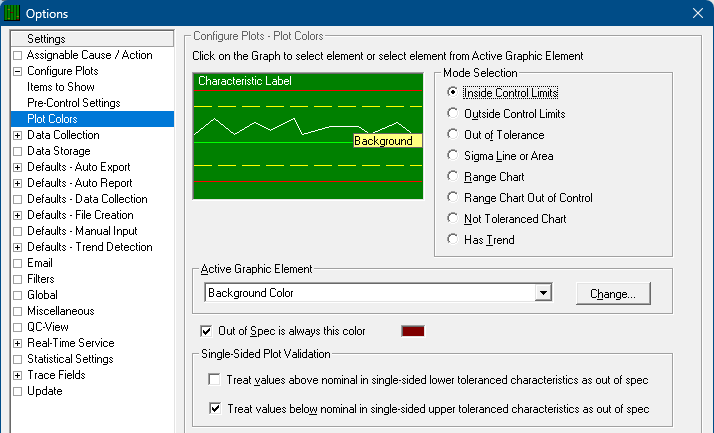
- Start by choosing the Mode Selection. This is the type of plot you wish to edit. For example, choosing Inside Control Limits will edit the colors that are shown when data is good. Choosing Outside Control Limits lets you choose what a plot will look like when the last value is out of control.
- Choose the Active Graphic Element whose color you want to change. The Active Graphic Element is the portion of the plot to change such as the Data Line, Labels, Background Color, etc.
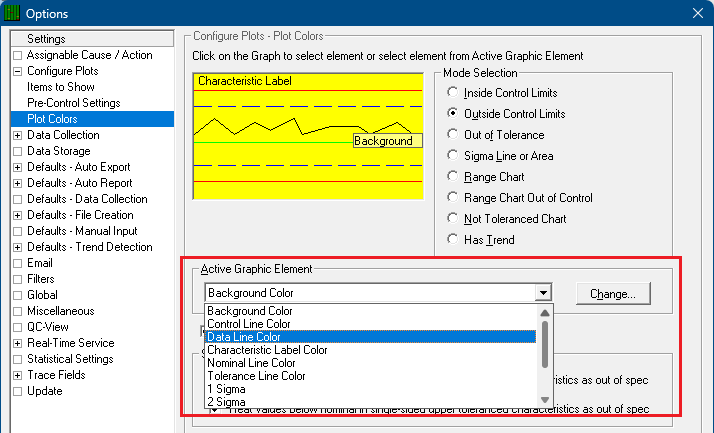
- Click Change... and choose a new color from the [Element] Color window that appears.
- Repeat the above steps for all Elements and Modes where changes are needed and click OK when finished.