This article describes how to configure the Real-Time Plots to show what you want to see.
Steps
- In QC-CALC Real-Time, go to Tools > Options > Configure Plot Settings > Items To Show.
- Choose how many points you want to be displayed in each plot at one time by typing a number into the Plot Points box.
NOTE: Any off-screen points still exist and can be brought into view using the scrollbar at the bottom of the screen.
- Choose the Calculation you want displayed in the lower left corner of each plot.
NOTE: This value will only appear if there is room on the plot.
- Choose the amount of Plot Detail to be shown on each plot by checking/unchecking the boxes corresponding to various visual components such as Control or Spec Limits, Labels, ...
- Optionally, display Sigma Zones by either line or by color. You can display any combination of 1, 2, and 3 sigma.
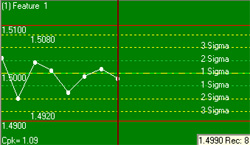
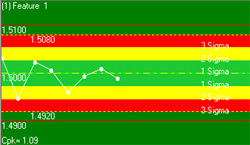
- Type the number of points to use when determining the background color of the plot. Typically, this number will be set to 1, but if you inspect a lot of parts, you may want to change the color if any of the last 5 parts are bad.
You can also use the sub-group average to determine plot colors. This option is checked by default. - Starting in version 3.4, you can also control what value is shown for the Plot Label (Characteristic Label and or Extra Info field) and how to determine the Plot Height.
- When finished click OK.