Trend Detection - Other Patterns
All trend detection is done by highlighting the plot line where the trend occurs and adding a label at the top of the plot indicating the trend that was found. You can optionally configure settings like which trends should be detected and how many points constitute a particular trend. You can also toggle trend detection on and off.
The Other Patterns should be watched in addition to the instability patterns. The ability to recognize these patterns can greatly increase the usefulness of the control chart by permitting a more complete interpretation of its meaning. These patterns are different from the patterns of instability in that both halves of the control chart are considered together in looking for the patterns.
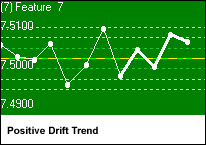
Drift Trend Analysis
Drift Trends are indicated by a general change in the average range (high and low) of points in one direction. The number of points considered is configurable.
Stratification
QC-CALC will identify a stratification trend when at least fifteen consecutive points fall within one sigma of the nominal. If the up-and-down variations are very small in comparison with the width of the control limits, the control chart indicates stratification.
Stratified patterns are frequently the result of incorrect calculations of the control limits or the misplacing of a decimal point. The number of points to consider is a configurable value.
 Mixtures
QC-CALC can detect a mixture trend exists when eight consecutive points are on either or both sides of the centerline with none of the points falling within one sigma of the nominal. Another explanation of mixtures is if the pattern shows a tendency to avoid the centerline with too many points near the control limits.
The number of points to consider in the calculation is configurable for mixtures.
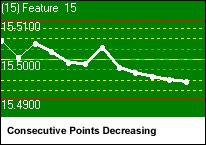
Consecutive Points Decreasing / Increasing
QC-CALC can alert you when a number of points in a row are either all decreasing or all increasing and the number is configurable. For example if you enter 5, the five points on the right side of the graph will be checked. If they are all increasing or all decreasing then a trend will be triggered. To check points that are not at the right edge of the graph, simply scroll the QC-CALC Real-Time screen backwards to view previous records and check them for trends.