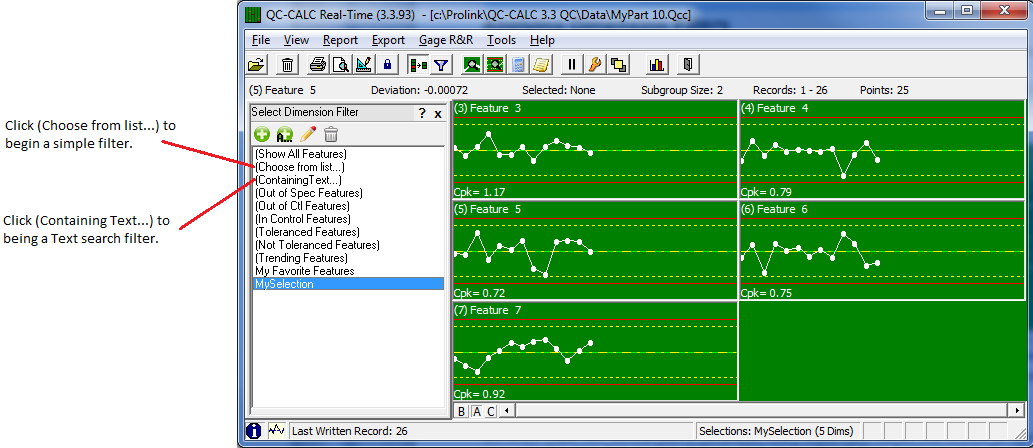
To reduce the number of plots (dimensions) displayed QC-CALC uses the concept of a dimension filter. This is a manual operation where you choose the dimensions you wish to display from a list. The list of dimensions was generated from your part program. You highlight the ones you want to see and click OK.
When you are inspecting parts on your CMM, QC-CALC Real-Time automatically saves your data assuming you want to see all dimensions. Therefore, all dimensions are selected by default. Clicking on a filter name in the list activates the highlighted filter and changes the graphs shown because the filter is instantly applied.
Dimension Filters
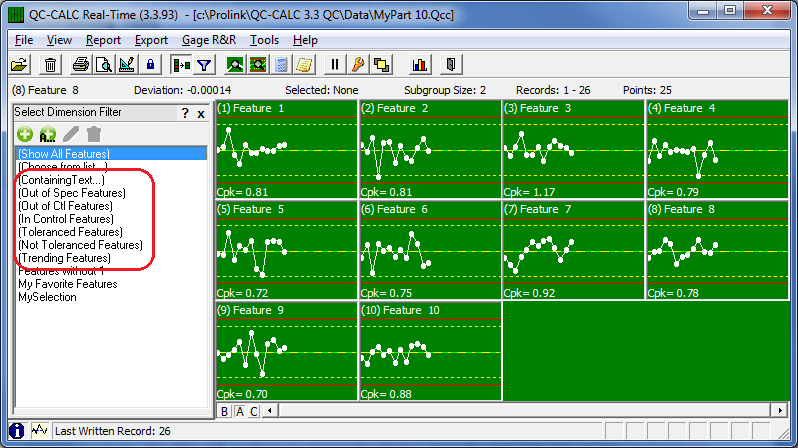
To view the dimension filter, choose menus View – Dimension Filter. The Dimension Filter panel is displayed in the Information Panel area and the plots are pushed to the right. You can add, change, and delete your own filters but there are permanent filters you cannot remove. When you create a new filter, you give it a name and it is added to the bottom of the list. Your custom filters are editable by clicking on the pencil and are deleted using the trash can.
Choose from List
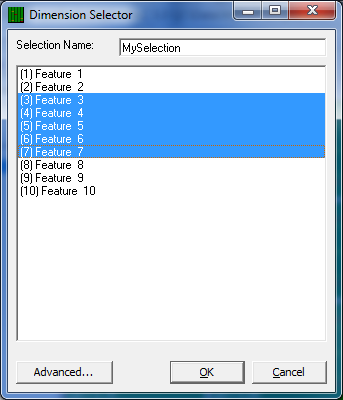
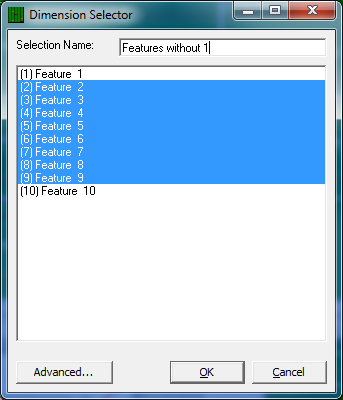
The (Choose from List…) filter is a static list of dimensions that you select with the mouse. The Dimension Selector is displayed showing all the feature names in the file and the features are easily chosen using a combination of the CTRL and SHIFT keys with the mouse. Click OK to display only the highlighted dimensions and automatically save the Dimension Filter using the name shown in the Selection Name area.
Note: Data is still collected for the dimensions that are not displayed.
Advanced Selection
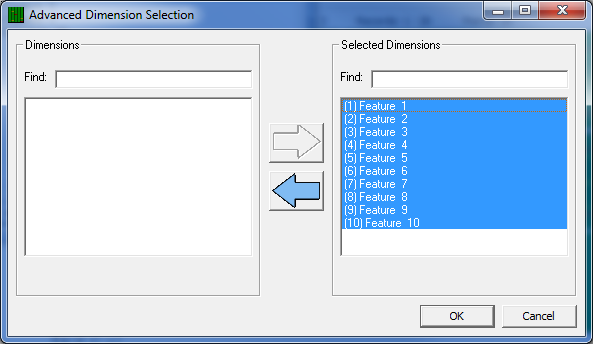
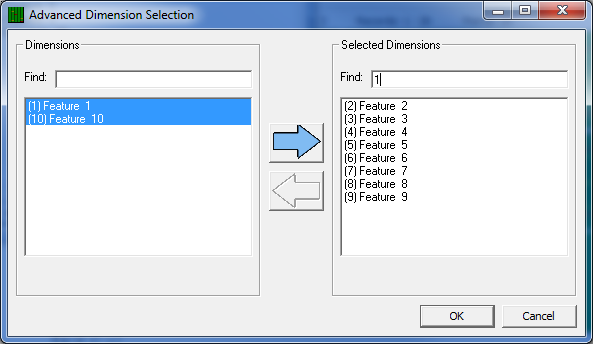
Click the Advanced button and the Advanced Dimension Selection window is displayed as shown below. This tool aids the selection process when a large number of dimensions exist. Selecting dimensions becomes difficult when your part program has more than 100 dimensions. Consider how difficult it would be to pick and choose 3000 dimensions from the list.
Clicking the Advanced button provides a label search capability that helps speed up the selection process. All dimensions that you move to the right panel will be displayed. By default QC-CALC selects all features to display so you will see all dimensions in the right panel when this selector is first displayed.
For example, suppose you have 200 dimensions in a QC-CALC file and you want to quickly find and remove all dimensions containing the number 1 in the label. Using the Advanced screen, type your text in the right Find window and instantly all labels containing the number 1 are highlighted.
Here we typed the number 1 and just the dimension labels containing a 1 are highlighted. The large left arrow becomes enabled allowing you to move your selection to the left panel.
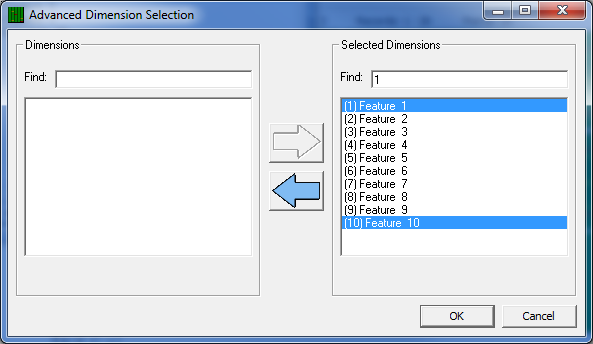
Click the left arrow and all selected dimensions are removed from the Selected Dimensions area. You can use this process as many times as needed to continue to reduce the Selected Dimensions on the right. You can easily move features back and forth to get just the right selection. Note: If your list is long you may not see all of the highlighted dimensions but understand they are selected even when out of sight.
Click OK in the Advanced Dimension Selection screen when you have finished and, optionally, give your selection a name.
Dynamic Dimension Filters
Choose View – Dimension Filter and a panel is displayed with a list of available filter names. Many of the Filters displayed at the top of the list are dynamic filters and your custom filters are added to the bottom of the list.
(Containing Text)
When you use Choose from List, you choose a static list of dimension numbers that do not change across part files. The Containing Text filter is dynamic and is re-applied when you open another QC-CALC file. In other words, use the Containing Text filter if you want QC-CALC to display all dimension labels that contain the letters TP no matter where they are positioned in the list.
For example, let’s assume your dimension labels for all true position dimensions always end with the letters “TP“ or maybe you use “PC” for all process critical dimensions. If this is the case, you can quickly create a dimension filter for your file by using the Containing Text option.
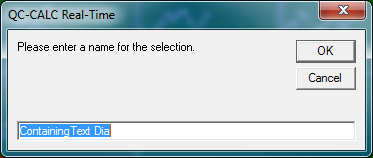
- Click on the words (Containing Text) or click the button and you are asked to enter the search characters. Dia was entered into the text box to be used as a filter. If you press the OK button your filter is used.
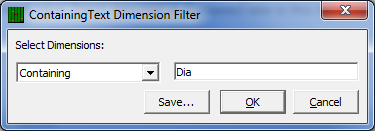
- Click Save… and enter a filter name to add this to the list of Dimension Filters available to use.
(Out of Spec)
This built-in dimension filter (dynamic) shows the dimensions that are out of specification (the Red plots). As inspection occurs, this filter will continue to change the display since the next part may or may not have any features out of specification.
(Out of Control)
This built-in dimension filter shows the dimension that are out of control and out of specification (the Yellow and Red plots). During Real-Time data collection the number of plots will change depending on their condition.
(In Control)
This built-in dimension filter shows the dimensions that are in control. (the Green plots). To see all plots containing only in-control plots, click on the In Control filter. This hides any and all out of control and out of spec dimensions.
(Not Toleranced)
This filter shows only the plots that do not contain tolerance values. If your part program contains non-toleranced features, QC-CALC plots the raw data but does not show any tolerance or control lines. If you have a large amount of plots and wish to hide the non-toleranced features you can click on the dimension filter labeled Toleranced Features Only. The non-toleranced plots are removed from the screen and all data is collected.
NOTE: Just because the filtered plots are not shown does not mean data collection has halted for these invisible plots. All data collection continues for all dimensions, we have only reduced what you see.
(Toleranced)
This filter shows the plots having tolerance information and therefore has red and yellow lines representing the values. These are the normal plots you would expect to see.
(Trending)
QC-CALC can show you only dimensions containing a trend but Trend Detection must be enabled. If you enabled the Real-Time trend detection and want to see just the dimensions containing the trends you requested, click on the Trend label. Trend detection is discussed later in this manual.