There are a couple of major sigmas that are available in ERS on-screen and in reports.
1. Sigma - This is the standard deviation of the numbers passed in. This uses the n-1 version of the equation and is used for Pp, and Ppk. It is also termed "Sigma (overall)".
2. SigmaPop - This is the standard deviation of the entire population of numbers sent in and is slightly different than the normal sigma in that it isn't using n-1 in the denominator of the equation. This is not used in any of our Cpk or Ppk calculations.
3. SigmaWithin - This is an estimated sigma that is used with subgroups. It is the main sigma that is used in Cp and Cpk. It is also termed "Sigma (within)". This sigma is calculated differently based on the subgroup size.
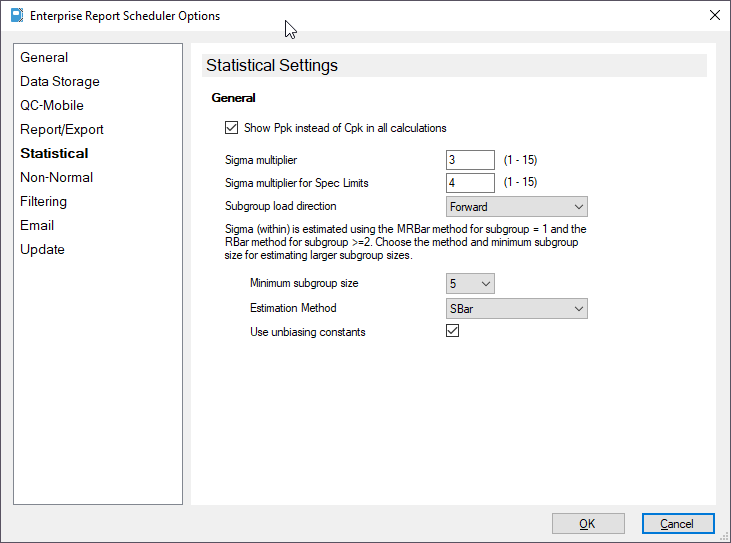
Subgroup = 1 - In this case, SigmaWithin = MRBar/d2. MRBar is the average moving range and d2 is a constant lookup table. Therefore, you calculate the moving ranges of the points passed and average them together. Then you divide by the value returned by the d2 lookup table passing in the subgroup size as the parameter. For the d2 table, we use the lookup value for 2 even though the subgroup size is 1.
Subgroup = 2-4 - In this case, SigmaWithin = RBar/d2. RBar is the average range. Since we have actual subgroups, we get the ranges (max - min) for each of them, average them, and then divide by the d2 lookup value.
Subgroup = 5+ - In this case, the customer can choose to either use SBar or Pooled Standard Deviation. SBar is an average of the standard deviations (sigmas) of each subgroup. The idea for this is that when the subgroup size is small (2-4), the range is appropriate and represents a good proportion of the points in the subgroup.
For instance, if the subgroup size is 2 then all points are represented since one of them is the max and one is the min. As the subgroup gets larger (i.e. 5), less and less of the points in any subgroup are represented. For instance, in a subgroup of 5 points, the max and min only represent 2 of the total 5 points. This means we are calculating sigma on only 2/5 (40%) of the data. As such, it makes more sense to switch to a standard deviation calculation.
SBar vs. Pooled Standard Deviation
This is up to the user, but pooled is typically used when the subgroup size varies between subgroups. The pooled standard deviation is a weighted average of the subgroup standard deviations. The weighting gives larger groups a proportionally greater influence on the overall estimate. This is not the case in QC-CALC where we calculate all of our subgroups as equal.
SbarBreakpoint/Minimum Subgroup Size
There are differences of opinion on when to switch to the SBar or Pooled Standard Deviation, but the general consensus is that it makes sense when the subgroup size is at least 5 (therefore, 5 and above). As such, we provide a numeric drop down to choose the breakpoint at which to start using either SBar or Pooled. To use SBar/Pooled and skip RBar, simply set the subgroup size to 2. Conversely, if you want to use the RBar method regardless, set the subgroup size to 99 and it will use the RBar as long as the subgroup size is below 99.
Unbiasing Constants
Checking this option will effectively take sigma and divide it by the C4 lookup to remove bias from the estimate. This option is only used with the SBar and Pooled estimates.
Sigma By R
Throughout the report templates, there are fields for both Sigma By R and Sigma Within. Please note that these return the same value. The only reason we are keeping Sigma By R is for backward compatibility. However, it is effectively deprecated.
ERS Statistical Settings Screen: