PREREQUISITES
SPC Office Buddy 3.2 with Charting
INTRODUCTION
From time to time, we get questions about why the charts and stats in the Prolink Charting package don't always match the statistics in Minitab. The reason is just a set of special settings that Minitab uses that are different from the standard ones used by Prolink Charting.
STEPS
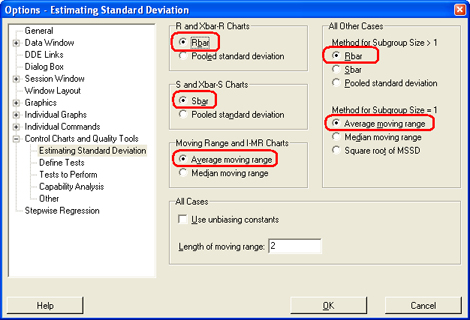
- In Minitab, go to Tools > Options > Control Charts and Quality Tools > Estimating Standard Deviation.
- Make sure the following settings are chosen on this screen.

- Click OK to save your settings.
- Done. When you re-run your reports, the stats such as the control limits will now match those in Minitab.