Introduction
Buddy offers several different options for reporting the number of defects per million. Specifically, you can use both Estimated and Observed PPM equations. Within each, you can report the PPM above the USL, below the LSL, and/or the total PPM. The various PPM options in Buddy will give you very different results, so we've decided to define them here.
Options
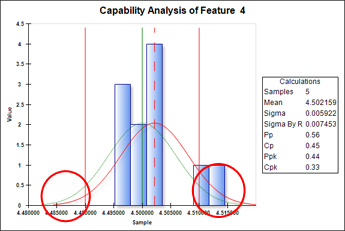
In general parts per million defective (PPM) refers to the number of parts outside the spec limits if a million parts were to be made. If we look at a distribution curve (bell curve), we see that at some point the curve crosses the upper and lower spec limits (see image above). What we are looking to find are the number of parts that are outside spec limits, assuming a normal distribution of data. These are the two tails of the bell curve (circled above). There are two types of calculations to get to this; Observed and Estimated.
Observed is a simple algebraic function that takes the number of defects in the current sample, multiplies it by 1,000,000 and divides by the total number of samples.
The equation for this is as follows:
PPM Observed = (Defects * 1,000,000)/Sample Size
This option is somewhat accurate, but accuracy doesn't increase until you have a lot of samples. In Buddy, we do this separately for both upper and lower spec limits and then combine them. This way, you can report on the upper, lower, or the total.
Estimated is a statistical function that uses a Z value and the Cumulative Distribution Function to determine the area under the tails bell curve as of a certain point (in this case the spec limits). This number is then converted into an estimated parts per million failure rate. Again, we do this for both upper, lower, and total so you can report any/all of the three.
The various options are listed below:
{PPM Above USL - Est} - Gives you estimated parts per million where the values are above the upper spec limit.
{PPM Below LSL - Est} - Gives you estimated parts per million where the values are below the lower spec limit.
{PPM Total Defects - Est} - Gives you estimated parts per million where the values are either above the upper spec limit or below the lower spec limit.
{PPM Above USL - Obs} - Gives you the estimated parts per million where the values are above the upper spec limit based on the observed samples included in the equation.
{PPM Below LSL - Obs} - Gives you the estimated parts per million where the values are below the lower spec limit based on the observed samples included in the
equation.
{PPM Total Defects - Obs} - Gives you the estimated parts per million where the values is either above
the upper spec limit or below the lower spec limit based on the observed samples included in the
equation.
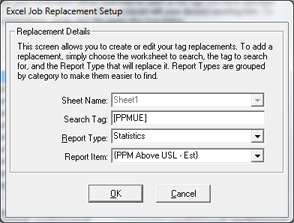
Below is a screenshot of the Excel Job Replacement Setup screen where you can choose your options.
More Information
All 6 of these options, along with the Z Upper and Z Lower values, are available both as individuals (discussed above) and as lists (i.e. {All PPM Above USL - Est}.