The default Raw Data reports that come with QC-CALC may not show as many columns of data as you need. This White Paper will give step-by-step instructions for designing your own custom template and adding another column of data to one of the standard Raw Data templates.
The Report Designer
The directions shown here will add an 11th column of actuals to the report. This is a lengthy process but relatively simple to accomplish.
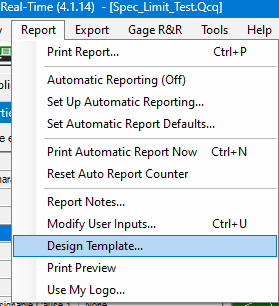
- From QC-CALC Real-Time, choose the Report > Design Template menu.
- Make a copy of the DataStat.raw template (highlight the file, CTRL + c to copy and CTRL + v to paste within the same list) in the list, highlight the copy, and click Open.
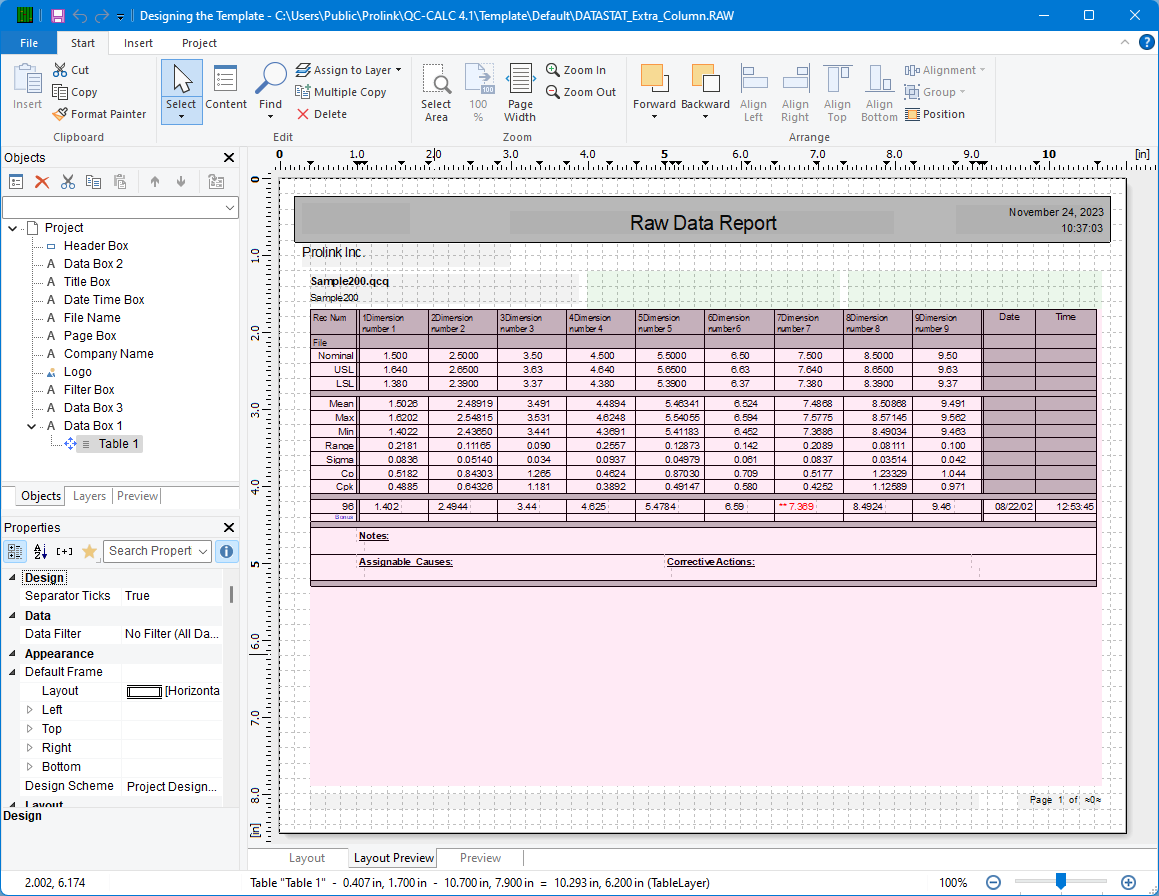
- The Report Designer now appears on the screen as shown below.
Header Lines
- Double-click on the table, and the Table Contents window will appear.
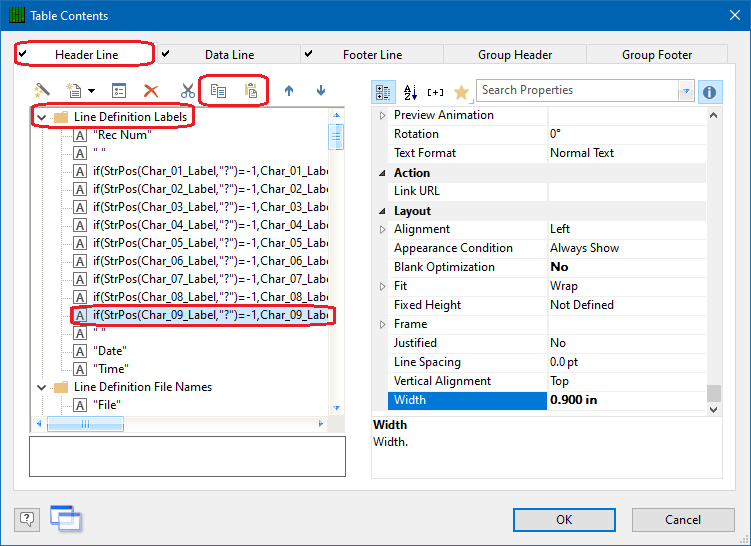
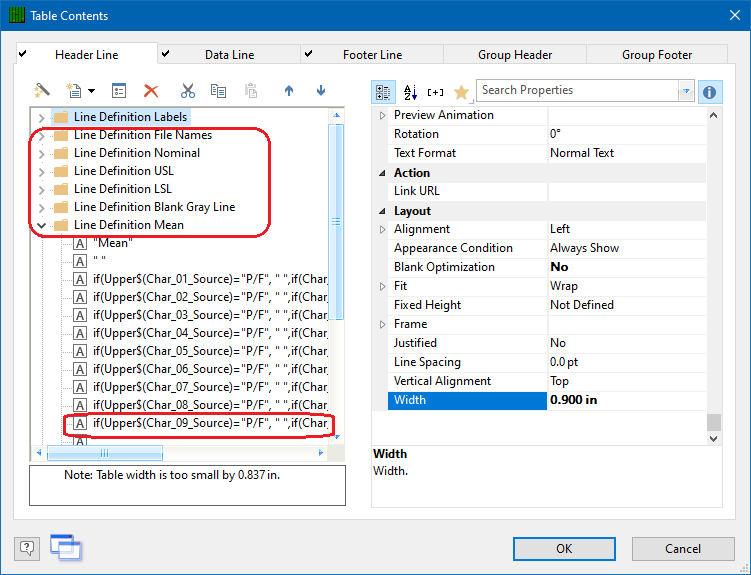
- Choose the Header Line tab, highlight the “Char_09_Label” line in the Line Definition Labels area, and click the Copy (
 ) button.
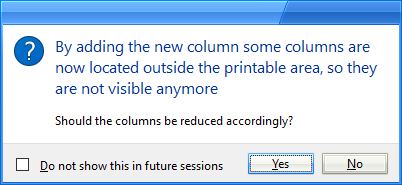
- With that same line highlighted, click the Paste button (next to Copy) and you should see warning about lack of space in the table. This will need to be handled later, so click the No button so the columns remain the size they were. Clicking Yes would only fix 1 row and there would still be a lot to fix in the other rows, so it is not worth the time to have this automatically fixed.
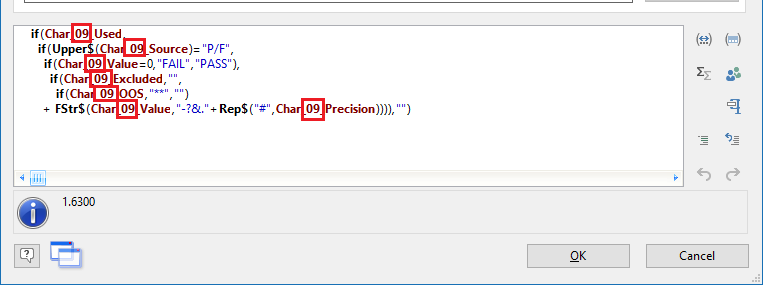
- In the Line Definition Labels area you will now see 2 identical lines next to each other. Double-click the bottom version of that line and you will see the Edit Table window.
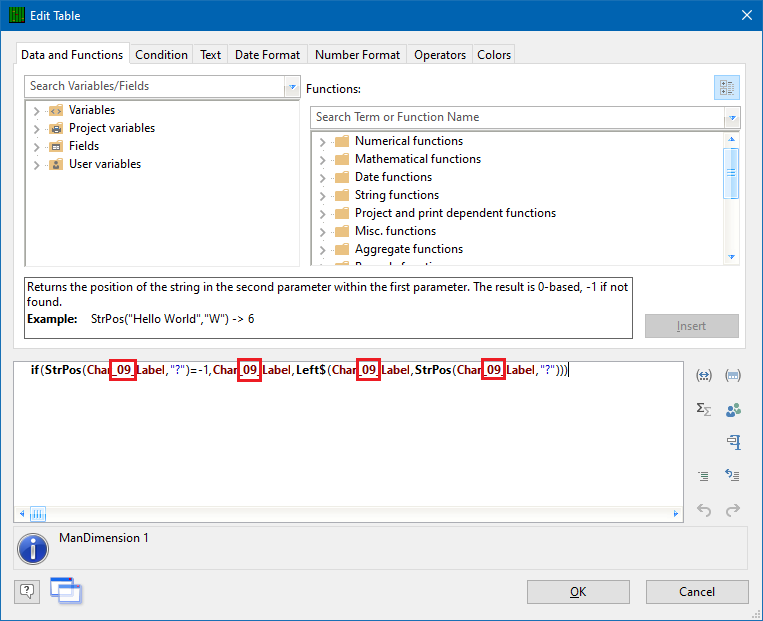
- Replace all instances of “09” with “10” in the window at the bottom of the screen, then click OK.
- Now that the Label is fixed for the 10th column, repeat steps 2 - 5 for all of the “Line Definitions” in the Header Line area except any “Blank Gray Line” lines.
Data Lines
Now that all of the Header Lines are set, it is time to switch to the Data Line tab.
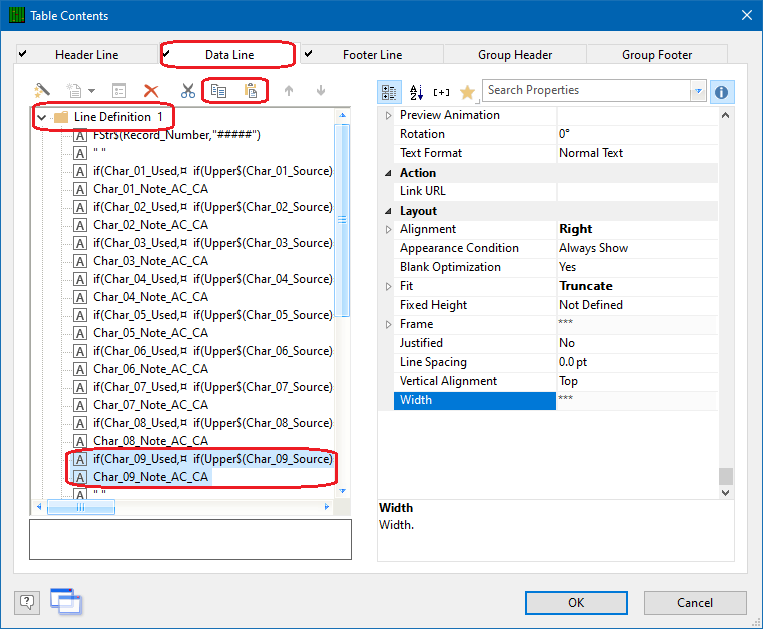
- There are 2 lines in the “Line Definition 1” area for “Char_09”. Highlight both lines and hit the Copy (
 ) button.
 - Next, highlight the bottom line of the 2 lines you previously had highlighted, then click the Paste (
 ) button.
 - Double-click the top line of the bottom set of “Char_09” lines and change all “_09_” items to “_10_”.
- Repeat step 3 for the bottom line too.
- Copy and paste the “Char_09” line in the “Line Definition Bonus” area and change the values in the new line to “Char_10” also.
Clean Up
Most of the work is done now, but some cleanup is still needed to finish the report correctly. Some blank gray lines that appear on the report, along with the footer lines, need to be adjusted so they are the same width as the remainder of the rows of the report.
- On the Header Line tab, highlight one of the lines that was just added, and then look at the Width property at the very bottom of the list on the right side of the screen.
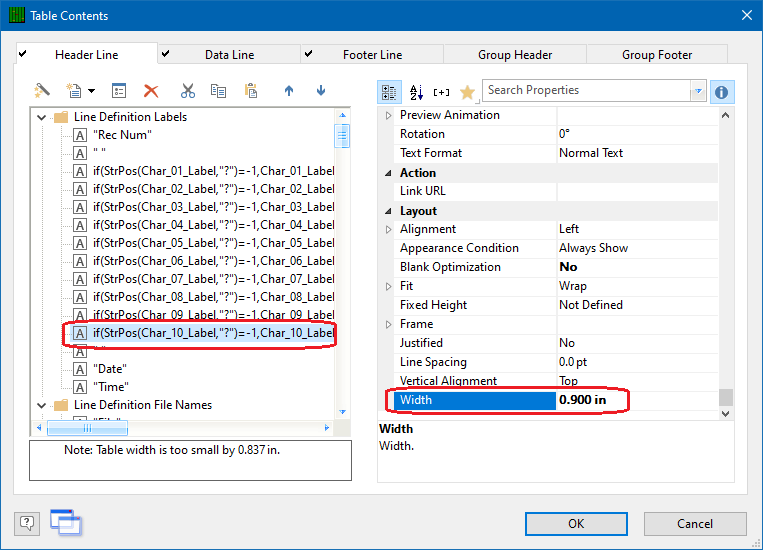
- That Width value will need to be added to the Width for a few other lines.
- Still on the Header Line tab, choose the “ “ item under the “Blank Gray Line” definition and change the Width value to 11.13 (10.230 + .900).
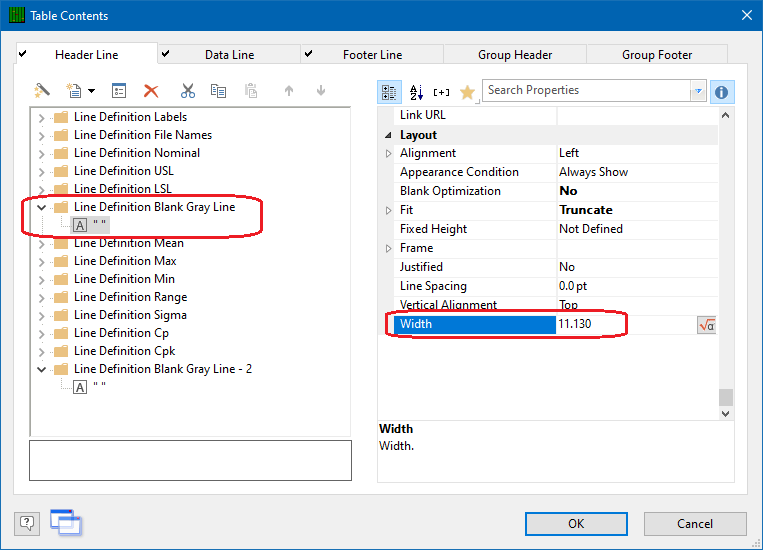
- Choose the “Blank Gray Line – 2” item and change it to the same value.
- Next, switch to the Footer Line tab. On this screen, a few items need to have their Width adjusted.
- For each “Line Definition” in this area, choose the bottom item for that section and increase the Width value for that item by .9. This means the “Blank Gray Line” items will both go to 11.13 like the previous steps, but the Notes and AC-CA lines will have different values.
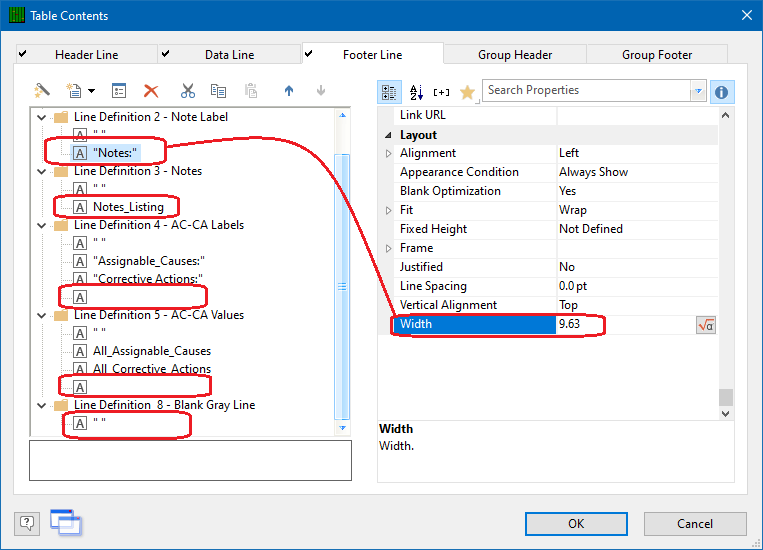
- In the picture above all of the items that need to be increased are circled and you can see the “Notes:” item Width started at 9.63. This value should be changed to 10.53.
- Click OK on the Table Contents screen and save your changes (File > Save).
- The last cleanup is stretching the table itself so it can display the new column correctly.
General Steps
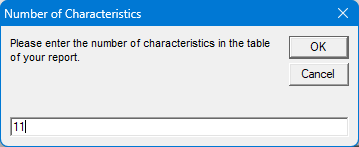
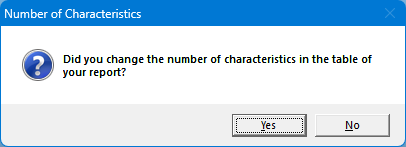
- Exit from the Report Designer, and you will see a question asking if you changed the number of dimensions in your report. Choose Yes on this message.
- The next window that appears will ask for the total number of dimensions now represented in this report. Answer this question with “11” so that your report will run correctly in the future.